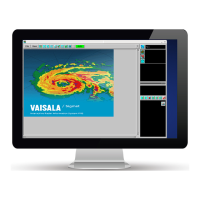
Figure 88 Cross-section with Typhoon Example
The window at the top left is a small format XSECT window. This appears automatically
when you make a cross-section. Note that because the radar cannot see all the way to the
surface of the Earth, the bottom of the cross-section is a curved boundary.
The cross-section line is shown on the display. The small arrow at the center of the line
shows how you see the cross-section. In this case the cross-section is viewed from the east
through the eye of the typhoon.
The XSECT tool, shown on the right, allows you to configure nearly all aspects of the cross-
section.
Cross-Section Display Color Scales
The cross-section uses the color scale configured in the Color Scale tool for the data type
that is being displayed.
The cross-section and base product color scales match if they have the same data type. For
example, if you ask for a cross-section of dBZ and the base product is dBZ, the color scale of
the cross-section match the input product.
IRIS Product and Display User Guide M211319EN-H
244 RESTRICTED