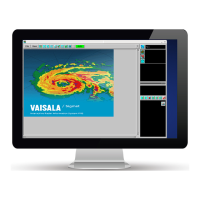
Figure 86 Typhoon Track Example
The elements of a typhoon track are shown in the example.
• Spiral Band Line is drawn on the display. You can drag the center point to change the
location, or drag the end of the spiral to change the rotation. The goal is to line up the
drawn spiral with one of the rain bands.
• Typhoon Track Points are indicated by the "+" with the time displayed beneath each
one. Note that the latest track point at 1048 is highlighted since this corresponds to the
frame that is currently displayed.
• Forecast Line or arrow shows the expected position of the eye, in this case, in 1 hour.
This line is also displayed in the highlight color to distinguish it from the track line.
• Target for the forecast is indicated by the "X" symbol. This is used for forecasting the
time of arrival at a position.
Chapter 6 – Quick Look Window
RESTRICTED 239