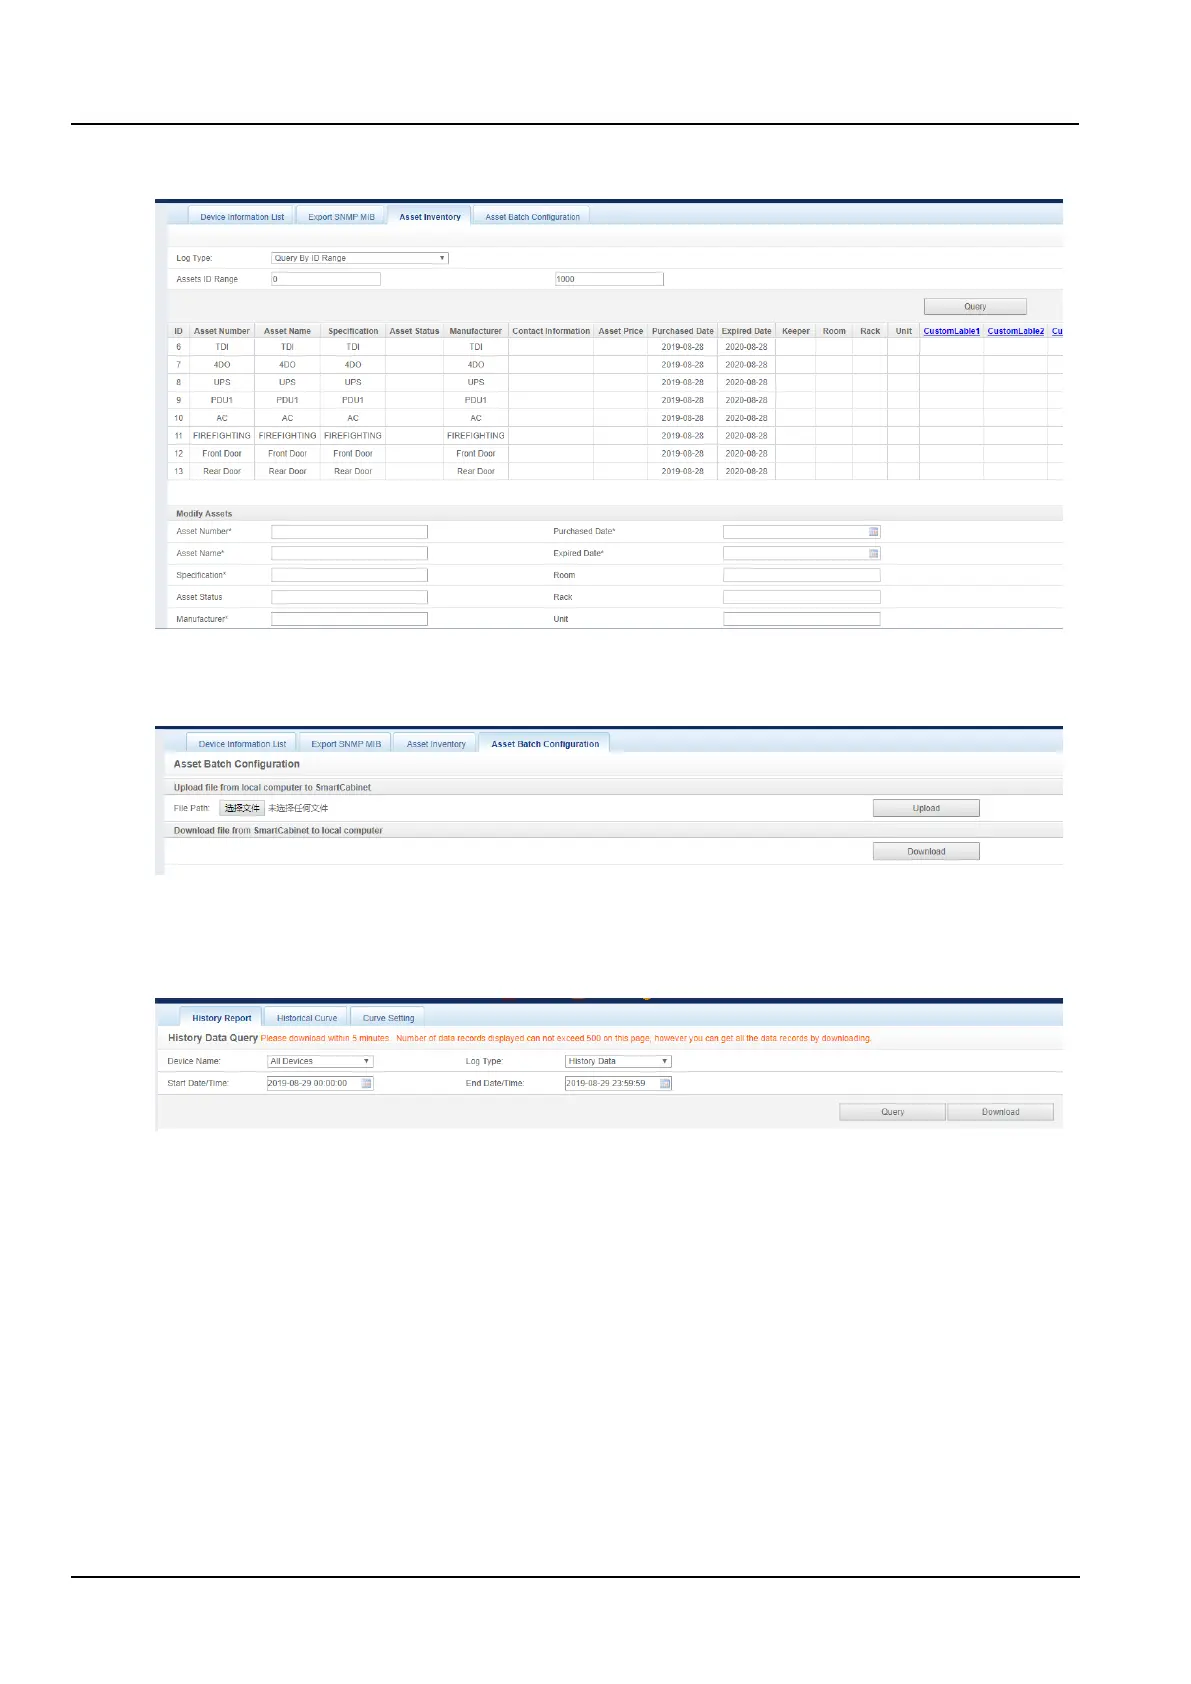
As shown in the Figure 3-76, the information of the asset can be queried according to the name, code, ID range, and
warranty expiry date.
Figure 3-76 Asset Inventory
4) Asset batch configuration
As shown in the Figure 3-77, the asset configuration can be uploaded and downloaded.
Figure 3-77 Asset batch configuration
b) History Data
Click the History data submenu under the Data & History menu to pop up the page shown in Figure 3-78. There are
three submenus: History report, Historical Curve and Curve settings.
Figure 3-78 History report
1) History report
As shown in the Figure 3-78, select a device name (for example, "All Devices"), select the log type (for example,
"Historical Data") and set the start Data/time and the end Data/time (for example, from 2019-08-21 11: 00: 00 to
2019-08-21 23: 59: 59), and then click on the Query button to list all historical data from the start time to the end
time. Click the Download button to download all the query results.
2) Historical curve and curve settings
Prior to selecting the Curve report name, first set the Curve Setting as shown in the Figure 3-79. For example, first
select a device type (for example, “ENP_AC_OU_OWN[COM]”), then select the Supply air temperature (other
options are also available), determine the Draw Reference line, and finally enter the name “AC supply air
temperature” in the report name.". Then return to the curve report, set the start time and the end time. If the historical
data is queried, the historical curve will be generated according to the signal.