6-14
IM80B80T10E 21th Edition : Jul.1,2007-00
< 6.INSTALLATION >
6.5.4
Dsiplay and Alteration of Linearizer Table
(
Maintenance
Mode
)
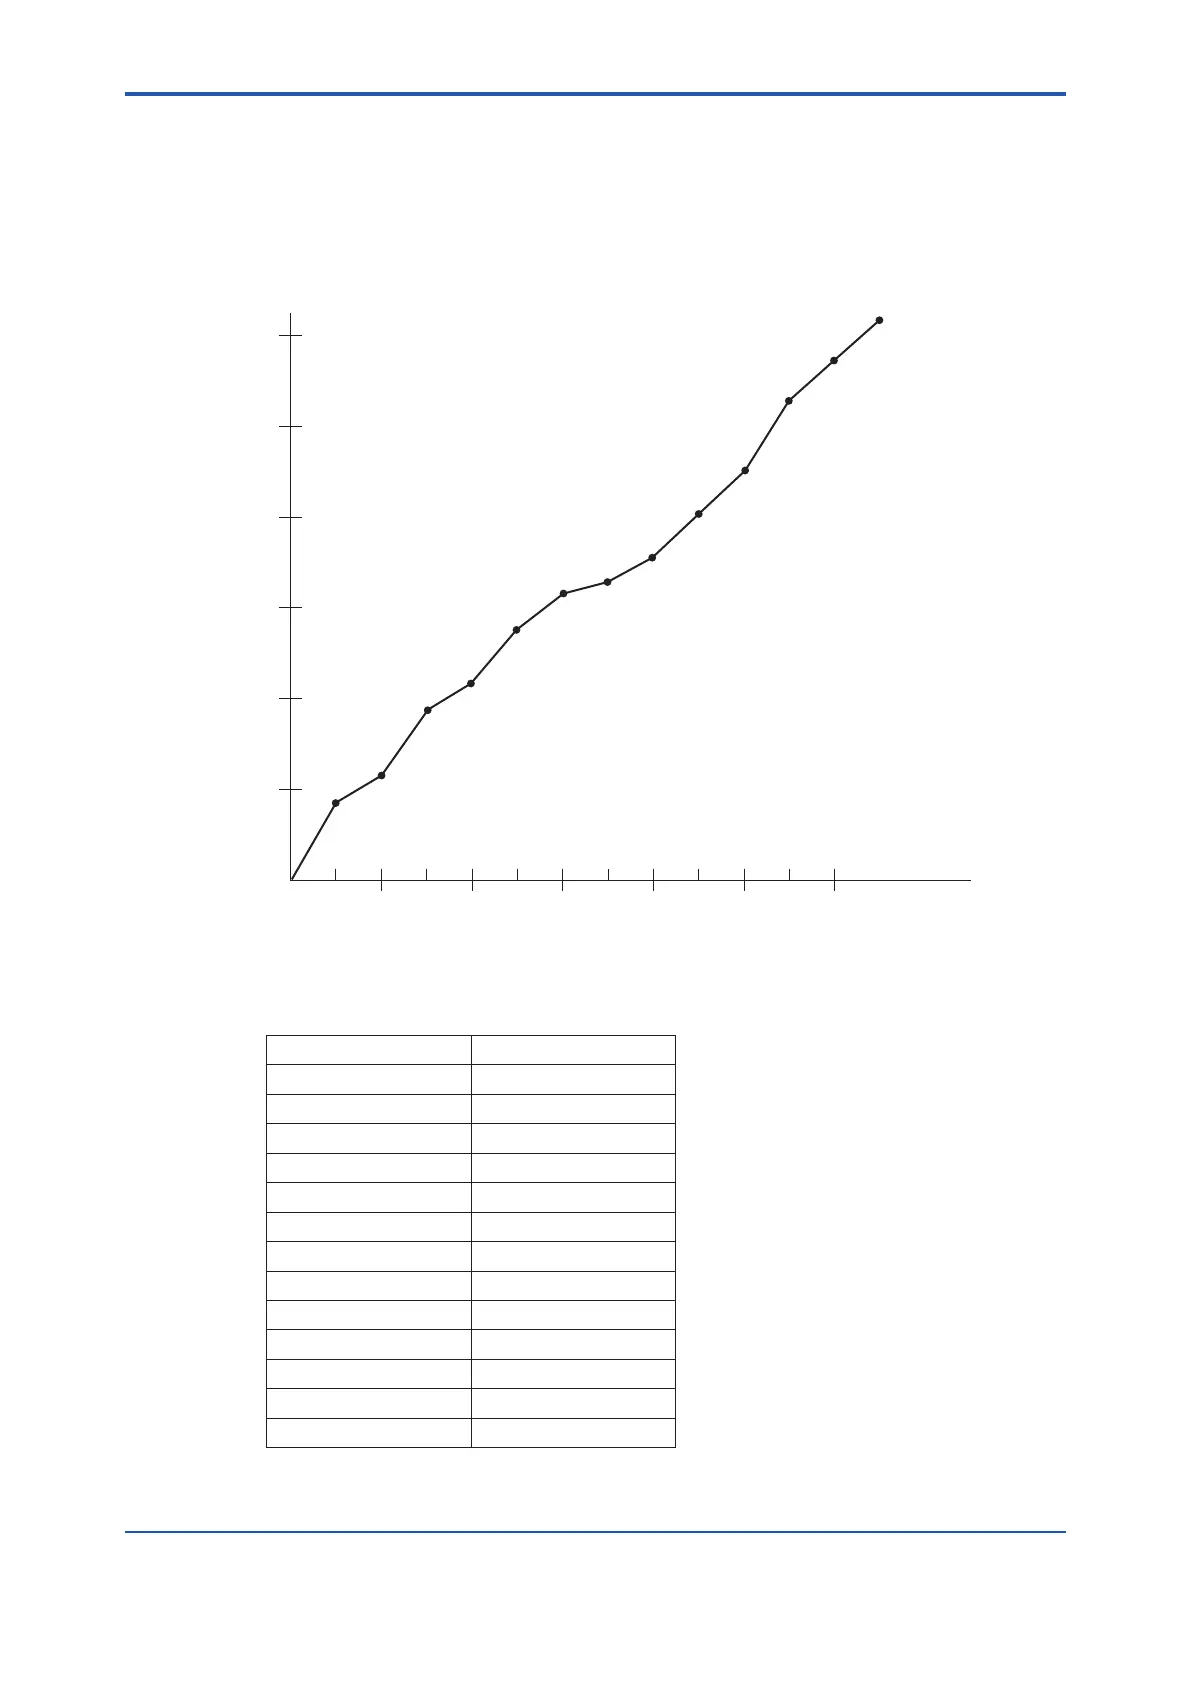
After milepost measurement has been completed, all sets of obtained data are used to calculate
the linearizer. In an actual situation, speed errors are corrected according to the linearizer which is
represented as line graph (in 5-kt. increments on the measured log speed axis ) as shown below.
10
10 20
30
40 50 60
20
30
40
50
60
0
knots
knots
Measured log speed
Calibrated log speed
The calibration curve is listed as a linearizer table as shown below.
Measured log speed Calibrated log speed
5 knot XX.XX knot
10 XX.XX
15 XX.XX
20 XX.XX
25 XX.XX
30 XX.XX
35 XX.XX
40 XX.XX
45 XX.XX
50 XX.XX
55 XX.XX
60 XX.XX
65 XX.XX
The linearizer table can be displayed and modied as follows:
 Loading...