24
IM 01B08B02-01EN
Monitoring and Control of Regular Operations (Operation Display)
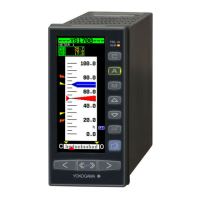
Monitoring and Operating the TREND Display
The TREND Display provides trend displays of PV, SV, MV, etc. in addition to the LOOP Display functions.
The TREND 1 Display can provide trend displays of PV1, SV1, and MV1; the TREND 2 Display can provide those of PV2, SV2,
andMV2;andtheTREND3DisplaycanshowthoseofanyfourdataselectedfromPV1,PV2,SV1,SV2,MV1,MV2,X1,X2,
X3,X4,X5,X6,X7,X8,Y1,Y2,Y3,andY4.TRENDDisplayalsoenablesdisplaydatatobeturnedON/OFF.Itdoesnotdisplay
control statuses and alarms that have occurred.
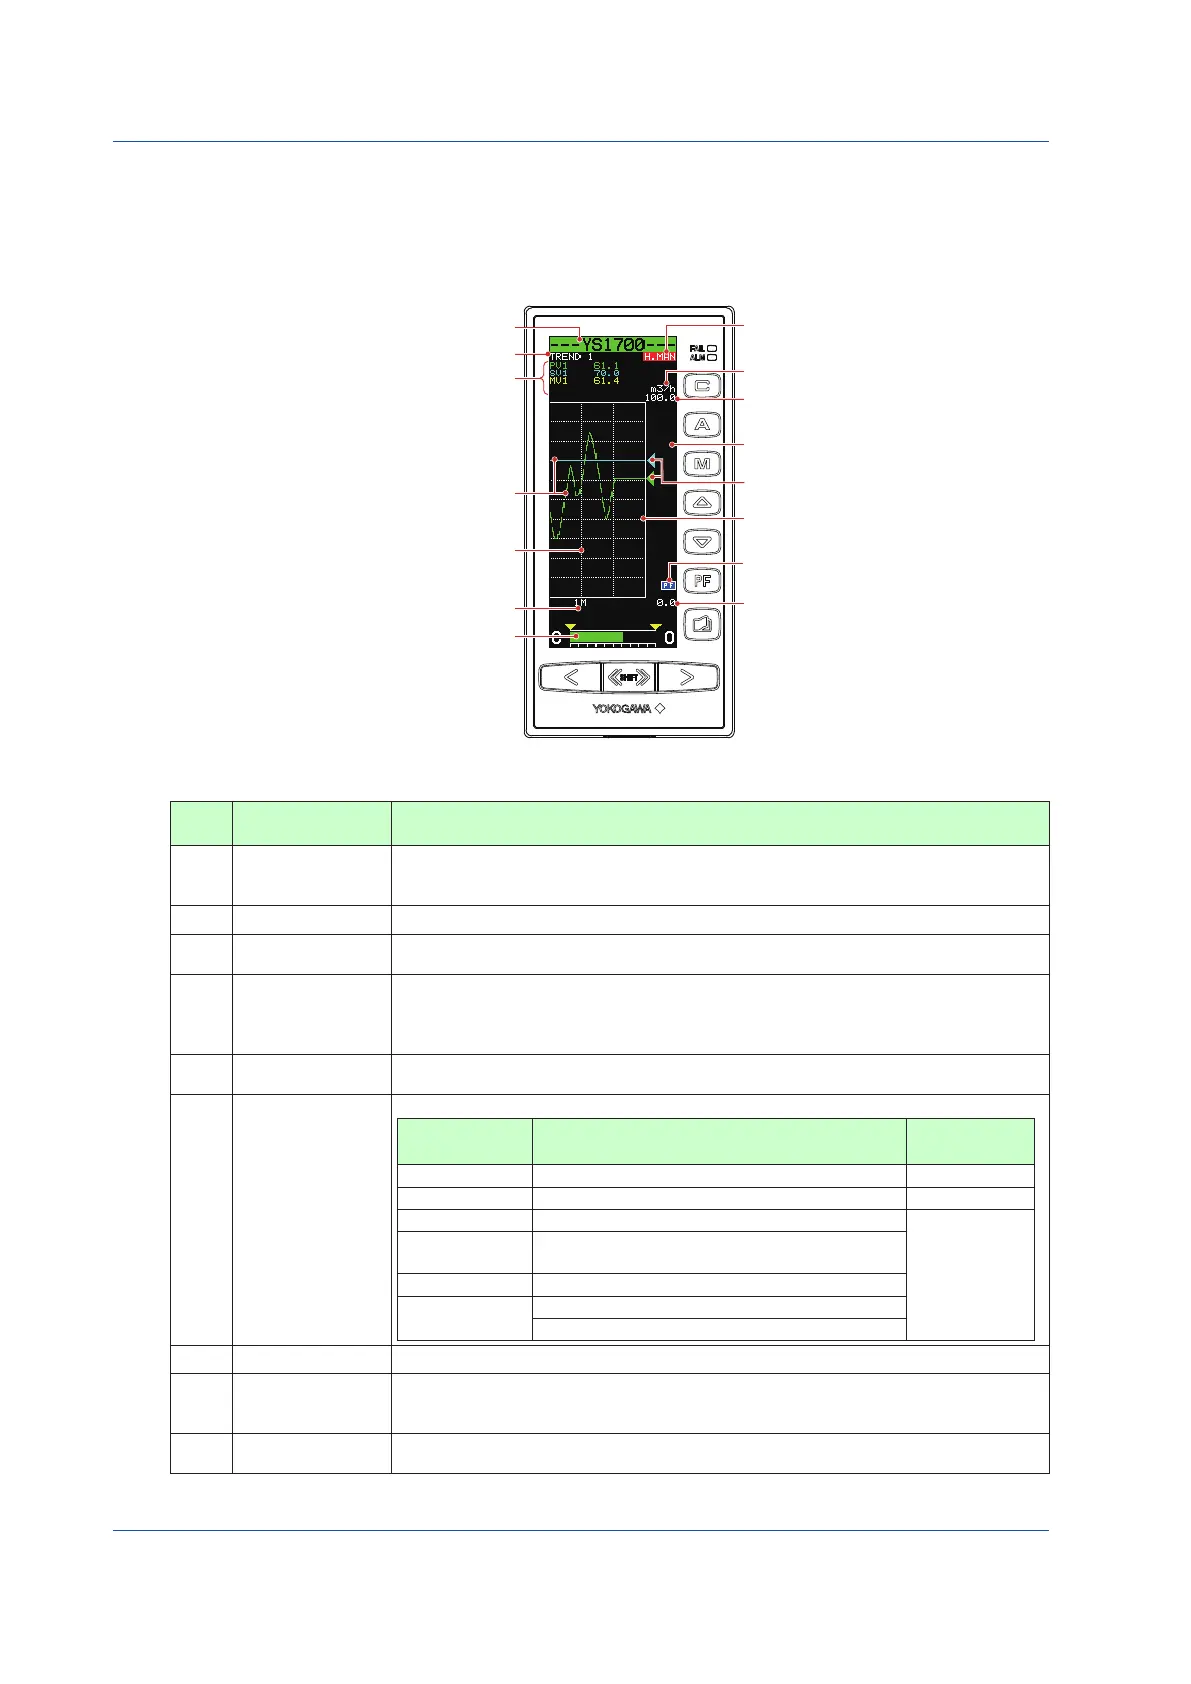
(5) Trend data 1 to 4 pointers
(14) Key LOCK status display
(13) PF key function display
(8) 0% value of scale
Tag number (1)
Display title (2)
Time span scale (10)
Trend display time span (11)
MV display (12)
(6) Operation status display
(7) Engineering units
(8) 100% value of scale
(9) Scale marks
Trend data 1 to 4 trend display (4)
Trend data 1 to 4 digital display (3)
0503E.ai
Figure 5.3
Table 5.11
No. in
Figure
Name Description
(1) Tag number
A tag number combining alphanumeric characters and symbols having a maximum of 12 digits
is displayed on a loop basis.
For TREND 3 Display, the tag number of the loop 1 is indicated.
(2) Display title The title of the display being shown is indicated.
(3) Digital display
PV, SV, and MV digital values are displayed.
For TREND 3 Display, data selections 1 to 4 are indicated.
(4) Trend display
The time span of the set trend display is divided into 60 partitions, and PV, SV and MV values
in the period of one time partition are displayed with the smallest and largest values of selected
data in the vertical line of one element. Trend display is clipped and displayed at 0% if a
relevant value is below 0% or at 100% if it exceeds 100%.
(5) Trend data pointers
PV, SV, and MV values and selected data are indicated with triangular pointers. The pointer
display moves up and down with a resolution of 0.5%.
(6)
Operation status
display
The controller operation status is displayed.
Display Description
Display
Priority Order
[POWER DOWN] Power down is being detected. (1)
[H.MAN] Hard manual selector switch has been activated. (2)
(No indication) The instrument is operating.
(3)
[STOP] Operation stopped (such as while setting a function
on the Engineering Display, etc.)
[TEST1] Test run mode 1 (only in the programmable mode)
[TEST2]
Test run mode 2 (only in the programmable mode)
Simulation program is being executed
(7) Engineering units Engineering units (UNIT) are displayed in a maximum of seven digits.
(8)
0% value of scale,
100% value of scale
The 0% value of scale (SCL) and the 100% value of scale (SCH) of PV and SV are displayed
on a loop basis in digital values of five significant digits (seven digits including a sign and
decimal point).
(9) Scale marks
A scale divided into a maximum of 10 divisions (10% segments) is displayed. Moreover,
horizontal lines corresponding to the scale marks are indicated in dotted lines.
 Loading...