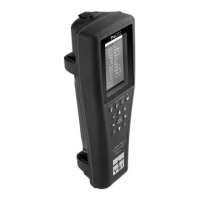
92
Plug a flash drive into the 2900 Series’ USB port, then touch the [Export] button to send the selected sample results from
memory to the flash drive.
When you have finished exporting data, touch the [X] button to return to the Main screen.
A folder named YSI\BiochemistryAnalyzer will be created on the flash drive. Sample data files are copied to the Data
subfolder. The data file name will contain the instrument’s Machine ID along with the date and time.
Example Sample Data File:
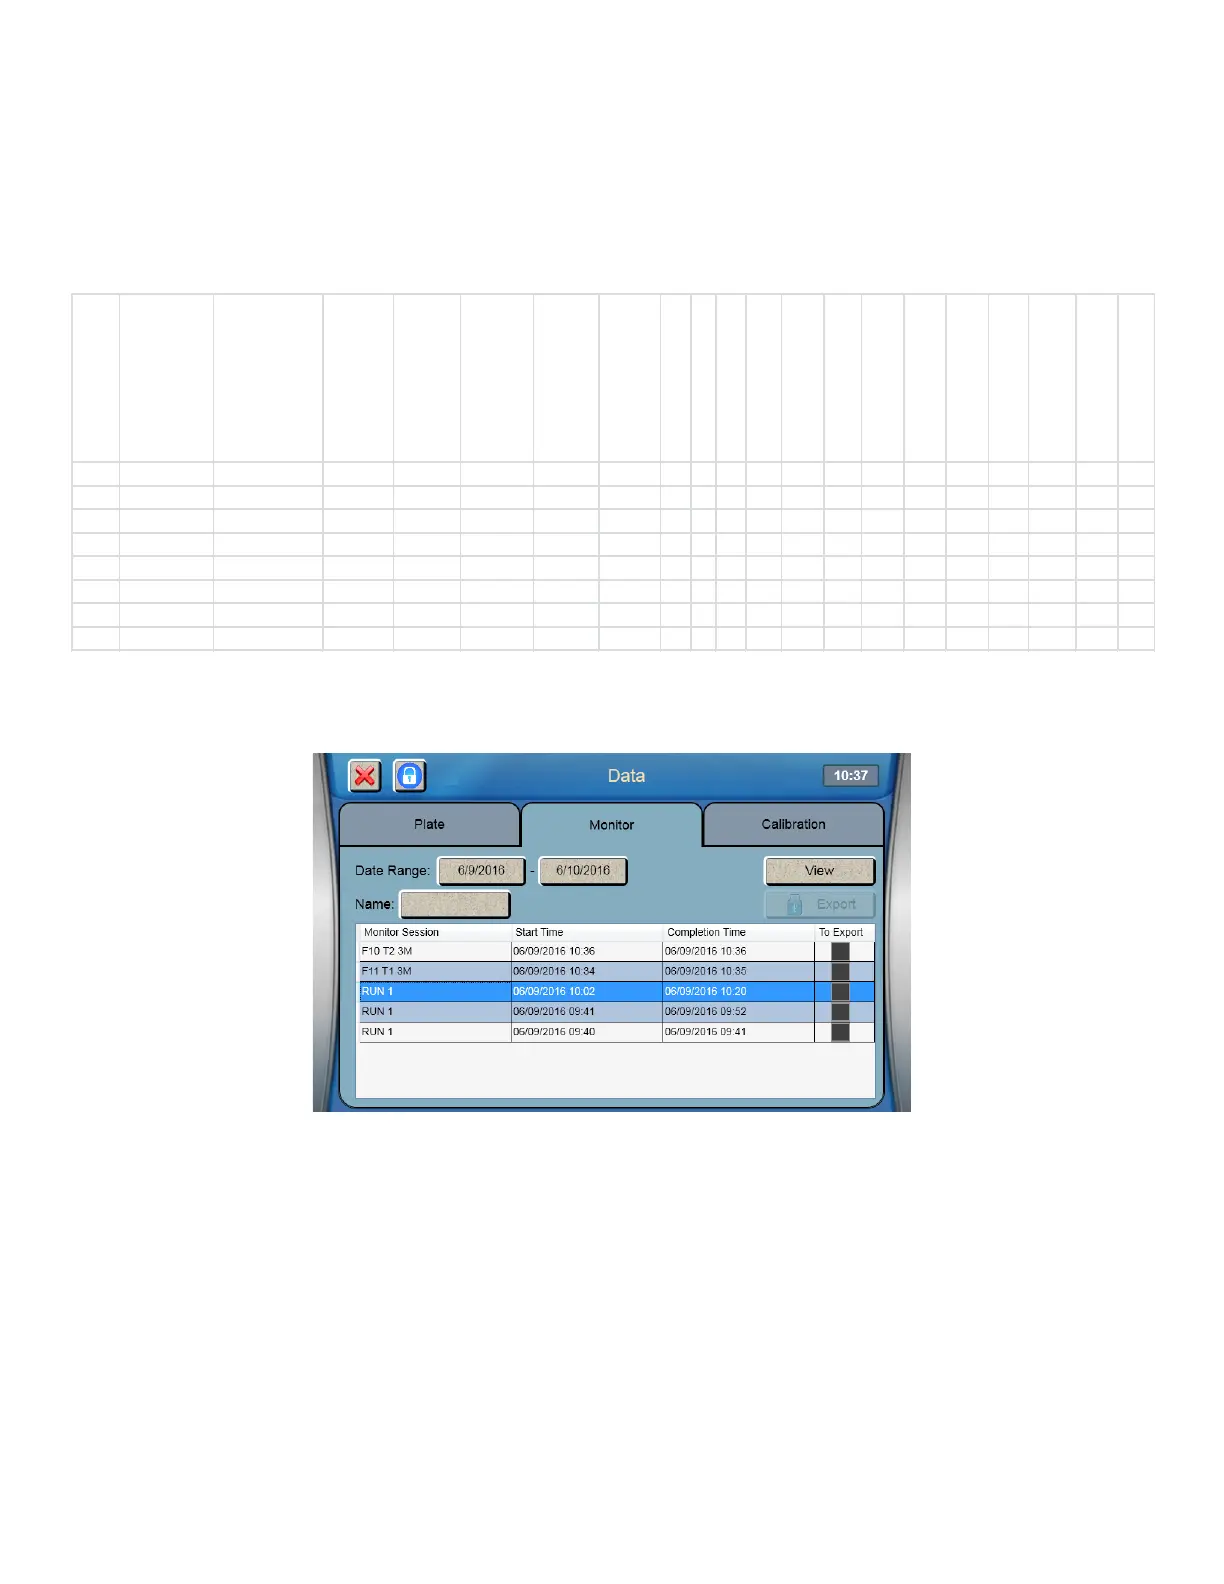
7.3.2 Monitor
Touch the Monitor tab to display the list of monitor sessions.
Select a monitor session, then touch [View] to display the graph for the selected monitor session.
Cross Net Plateau Temp Adj
P96-1 TestBatch-1 12/11/2013 10:31 Complete P96_A04 Glutamine Probe2B 0.10872 g/L 30 20 2.27 32.30 2.27 30.03 30.38 30.83 31.12 -0.022 24.55
P96-1 TestBatch-1 12/11/2013 10:31 Complete P96_A04 Glutamate Probe2A 1.43929 g/L 30 20 0.52 31.36 0.89 30.83 31.12 0.268 24.55
P96-1 TestBatch-1 12/11/2013 10:29 Complete P96_A05 Glucose Probe1A 4.60089 g/L 30 25 3.96 20.51 3.62 16.55 16.64 0.750 24.97
P96-1 TestBatch-1 12/11/2013 10:29 Complete P96_A05 Lactate Probe1B 0.80631 g/L 30 25 3.75 20.48 3.58 16.73 16.82 0.181 24.97
P96-1 TestBatch-1 12/11/2013 10:32 Complete P96_A05 Glutamine Probe2B 0 g/L 30 20 2.27 2.39 2.39 0.13 0.13 0.18 0.18 -0.422 24.46
P96-1 TestBatch-1 12/11/2013 10:32 Complete P96_A05 Glutamate Probe2A 0.00836 g/L 30 20 0.89 1.07 1.07 0.18 0.18 -0.165 24.46
R24-2 REACTOR 12 12/11/2013 9:58 Complete R24_A01 Glucose Probe1A 1.17388 g/L 30 25 3.39 7.61 3.60 4.22 4.25 0.158 24.97
R24-2 REACTOR 12 12/11/2013 9:58 Complete R24_A01 Lactate Probe1B 0.20807 g/L 30 25 3.28 7.59 3.39 4.32 4.34 -0.215 24.97