USER MANUAL | ICOS | INSTRUCTIONS | UM/ICOS-EN REV. B.2
Appendix I:Spectrum Displays
The following images show the
Spectrum Displays
for different analyzer types.
Table 13: Spectrum Displays for different analyzer types
GLA351-CCIA3 Enhanced Performance QC Rackmount Carbon Dioxide
Isotopic Analyzer
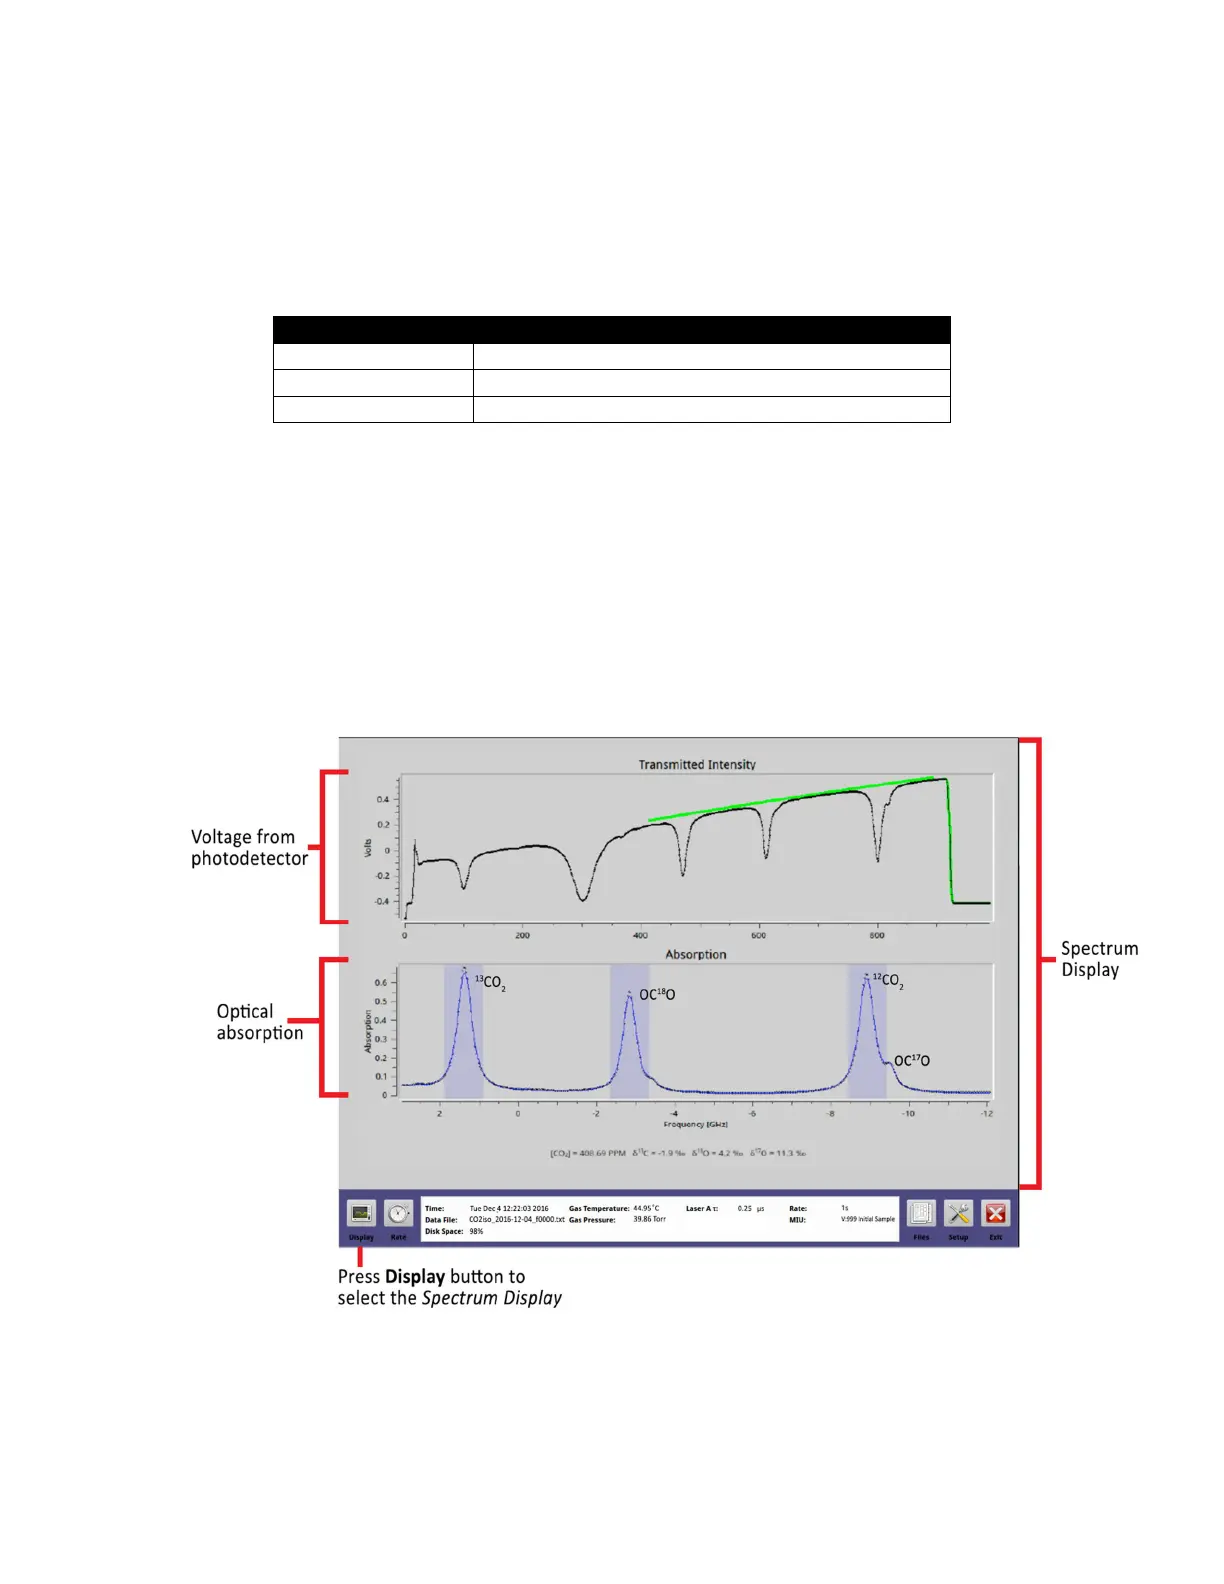
Figure 119 shows the
Spectrum Display
for the GLA351-CCIA3.
The CO
2
concentration is shown in parts per million (ppm) and 13C, 18O, 17O in ‰
(permil) on the bottom of the
Spectrum Display
.
Figure 119: Spectrum Display (GLA351-CCIA3)

 Loading...