USER MANUAL | ICOS | INSTRUCTIONS | UM/ICOS-EN REV. B.2
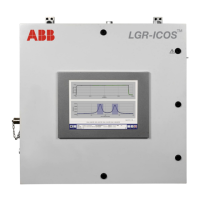
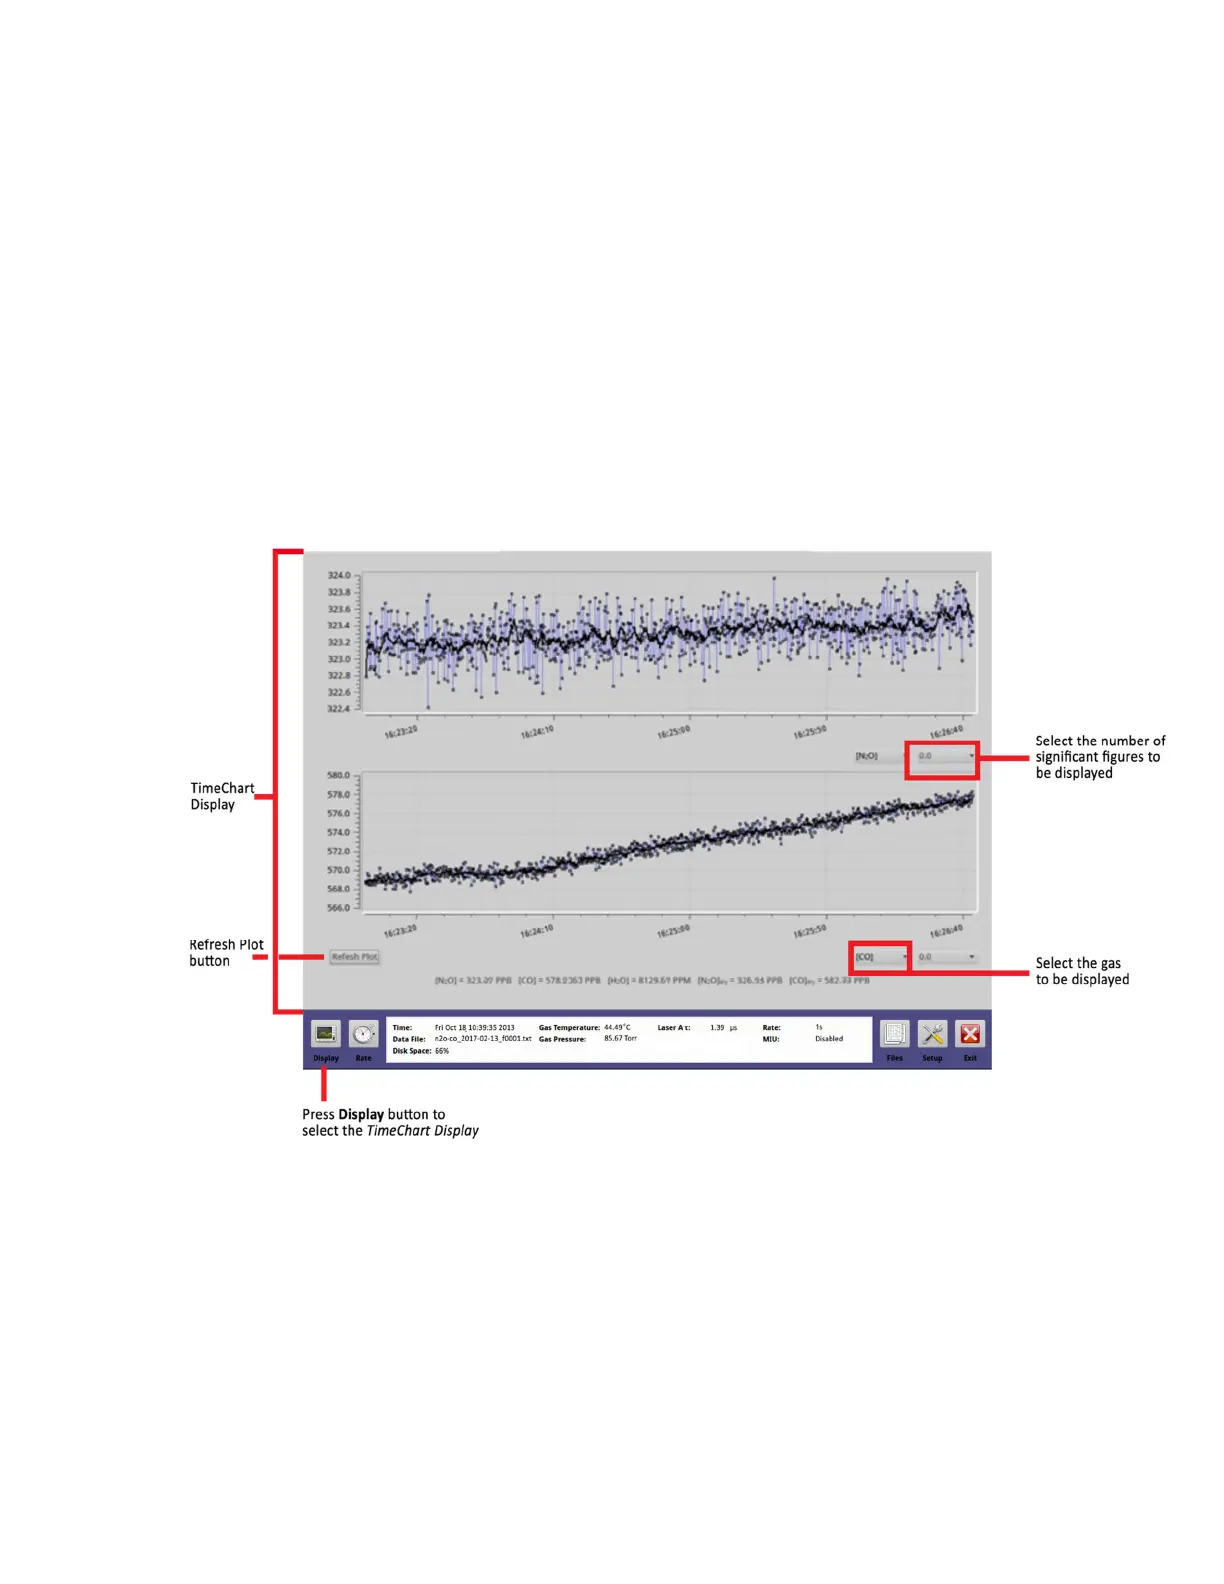
TimeChart Display
Click the Display button on the
User Interface Control Bar
to switch to the
TimeChart
Display.
The
TimeChart
Display is a real-time measurement of concentration vs. time.
Figure 31 shows the
TimeChart
with a continuous flow of gas. A 10-point running average
(in black) is shown going through the raw data (shown in blue).
Click on thedrop-down box in the lower-right corner of either window to toggle between
available gases, and to adjust the number of significant figures.
The data is saved to the file indicated in the left corner of the
parameter window
.
Figure 31: TimeChart Display (GLA351-N2OCM)

 Loading...