USER MANUAL | ICOS | INSTRUCTIONS | UM/ICOS-EN REV. B.2
Spectrum Display
Click the Display button on the
User Interface Control Bar
to switch to
Spectrum Display
.
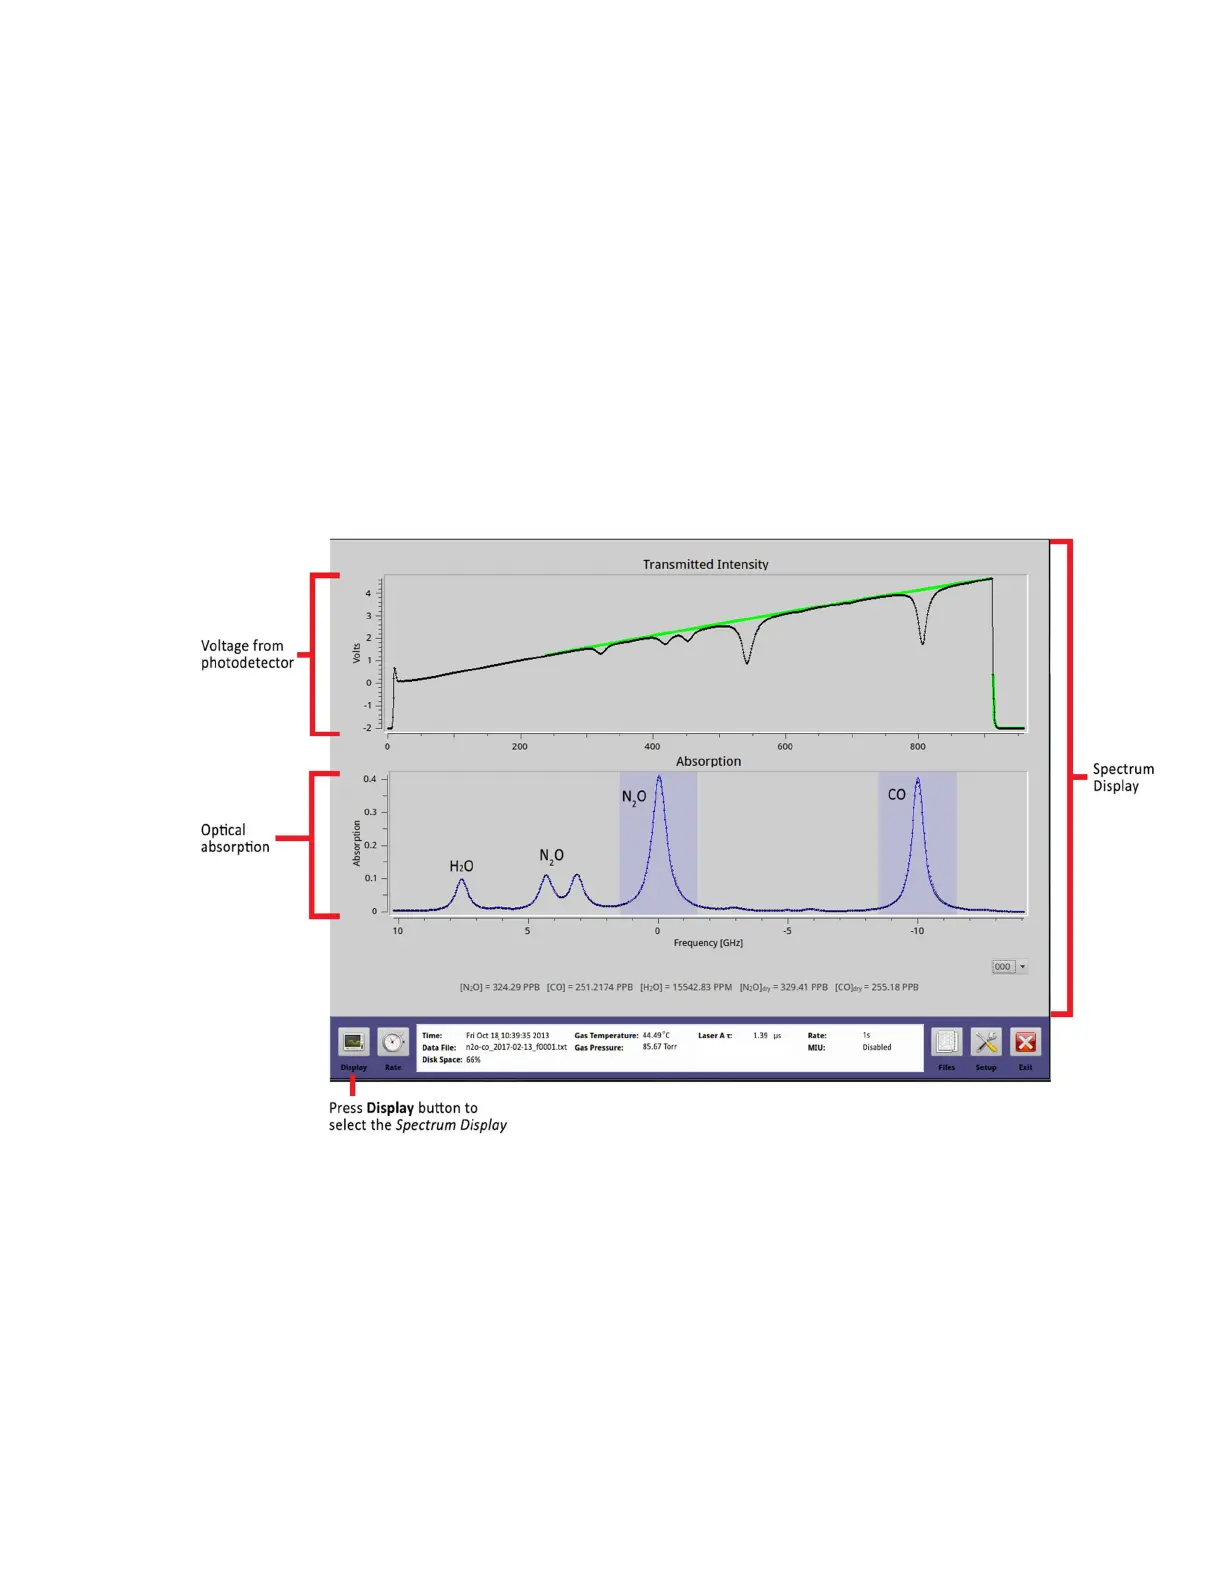
The top plot shows the voltage from the photo-detector as the laser scans across the
absorption features.
The bottom plot shows the corresponding optical absorption displayed as black circles and
the peak fit resulting from signal analysis as a blue line.
The measured concentrations are shown in parts per million (ppm), parts per billion (ppb)
or ‰ (permil) on the bottom of the
Spectrum Display
.
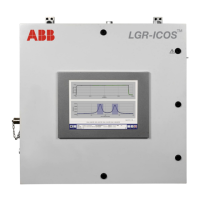
Figure 30 shows the
Spectrum Display
for the GLA351-N2OCM.
Figure 30: Spectrum Display (GLA351-N2OCM)

 Loading...