MN1941WEN Operation 5-35
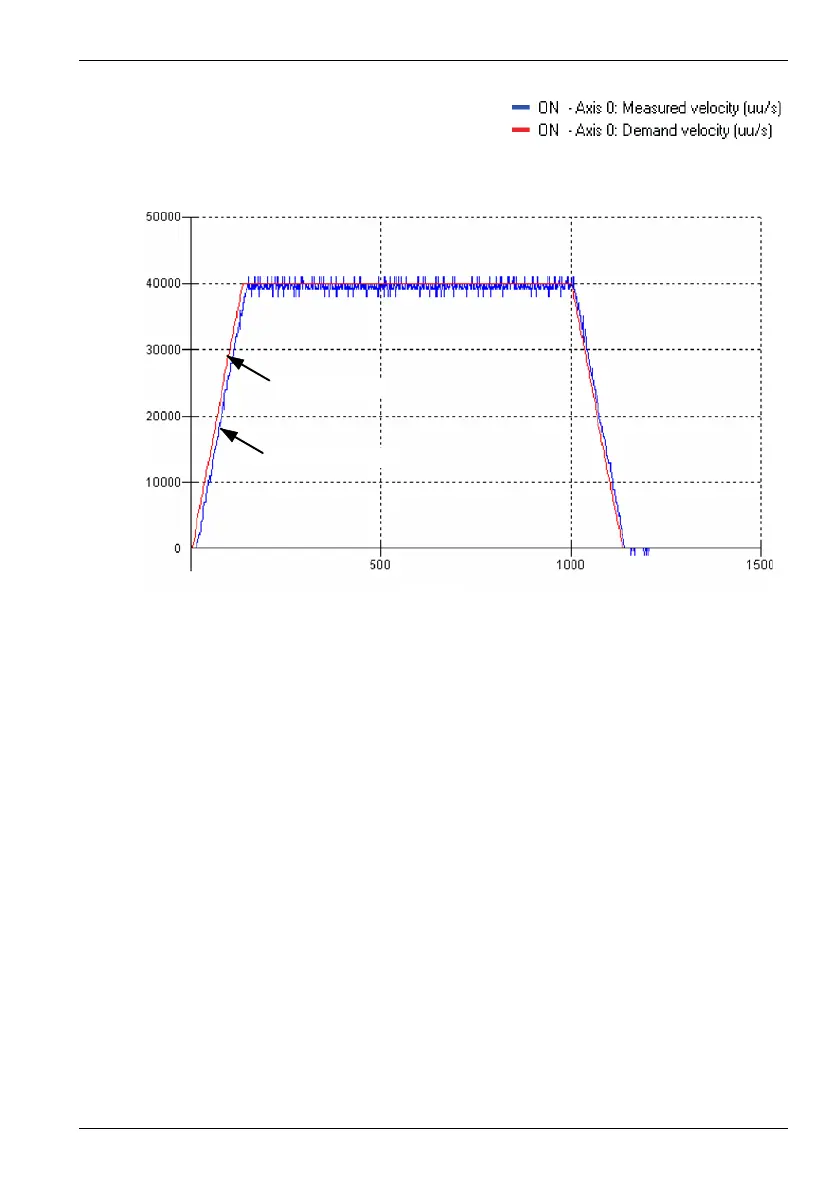
9. Using the check boxes below the graph,
select the Measured velocity and Demand
velocity traces.
Figure 41: Correct value of KVELFF
It may be necessary to make changes to the calculated value of KVELFF. If the trace for
Measured velocity appears above the trace for Demand velocity, reduce the value of
KVELFF. If the trace for Measured velocity appears below the trace for Demand velocity,
increase the value of KVELFF. Repeat the test after each change. When the two traces
appear on top of each other (approximately), the correct value for KVELFF has been found
as shown in Figure 41.
Measured velocity
Demand velocity
Time(ms)