Verifying Performance
TCD Checkout
Released: March 2004 6850 Series II GC User Information page 59 of 256
3. Select View/ Data Analysis. Load the data file for the blank run just
completed.
4. Select Report/ Specify Report. Choose printer and screen.
5. Select Integration/Integrate.
6. After integration is completed, Select Report/ Print Report. The
report will list measurements for noise (peak to peak, % standard
deviation, and ASTM) and for drift and wander.
• ASTM noise should be < 0.057 display units (25 µV/display unit for
TCD).
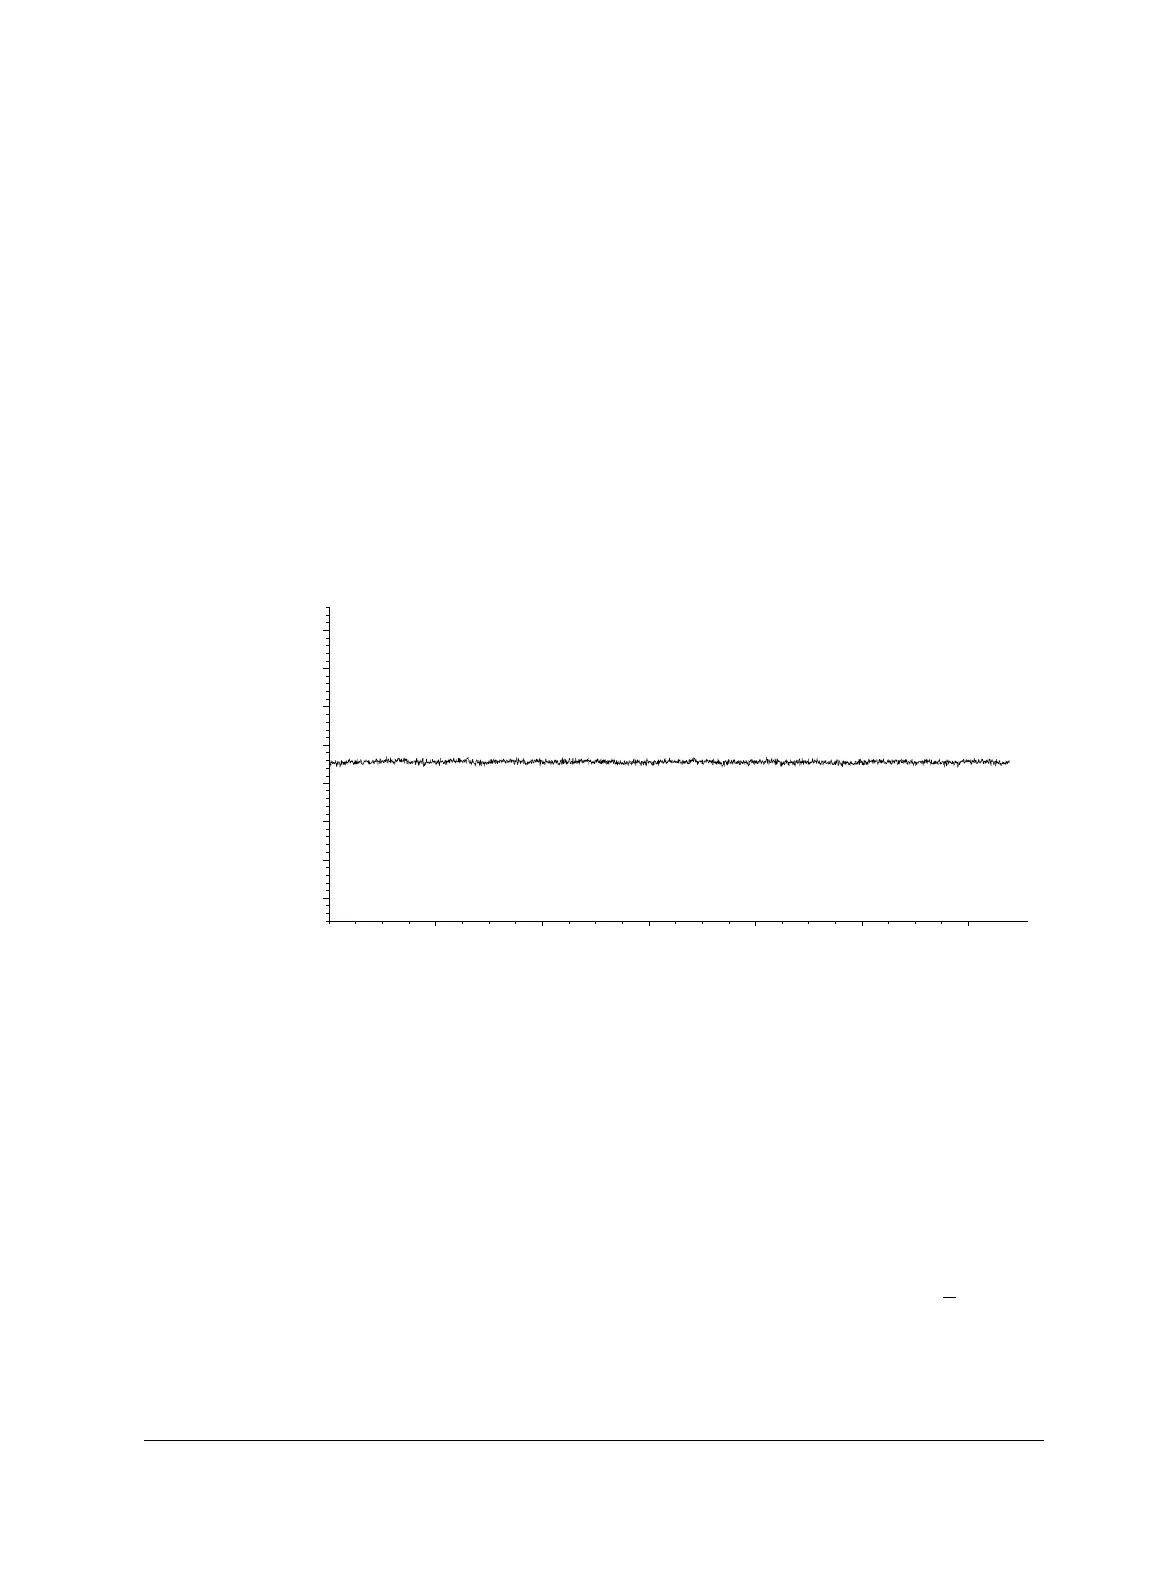
• Wander or drift (for a 5-minute time window) should be < 0.14 display
units.
Figure 6. Sample TCD noise, wander, and drift plot
Chemical checkout
1. Press Prep Run on the 6850 keypad to prepare the inlet for splitless
injection. When the message “Ready for manual inj” appears, inject 1 µL of
the checkout sample and press Start on the 6850.
2. The chromatogram should be similar to Figure 7. The acceptance criteria
are:
• Area counts for components labeled C14, C15, and C16 should each
be > 73.
• The area counts ratio calculated as C14/C16 should be 1.00 +
0.10.
• MDL (C16, pg/mL) = (1,272,000 × Noise) /(Area C16) ≤ 1,000.
0 2 4 6 8 10 12
25 uV
11.5
11.75
12
12.25
12.5
12.75
13
13.25
 Loading...