4- 13
Printing, Plotting, and Saving Measurement Results
Defining a Plot Function
Defining a Plot Function
1. Press .
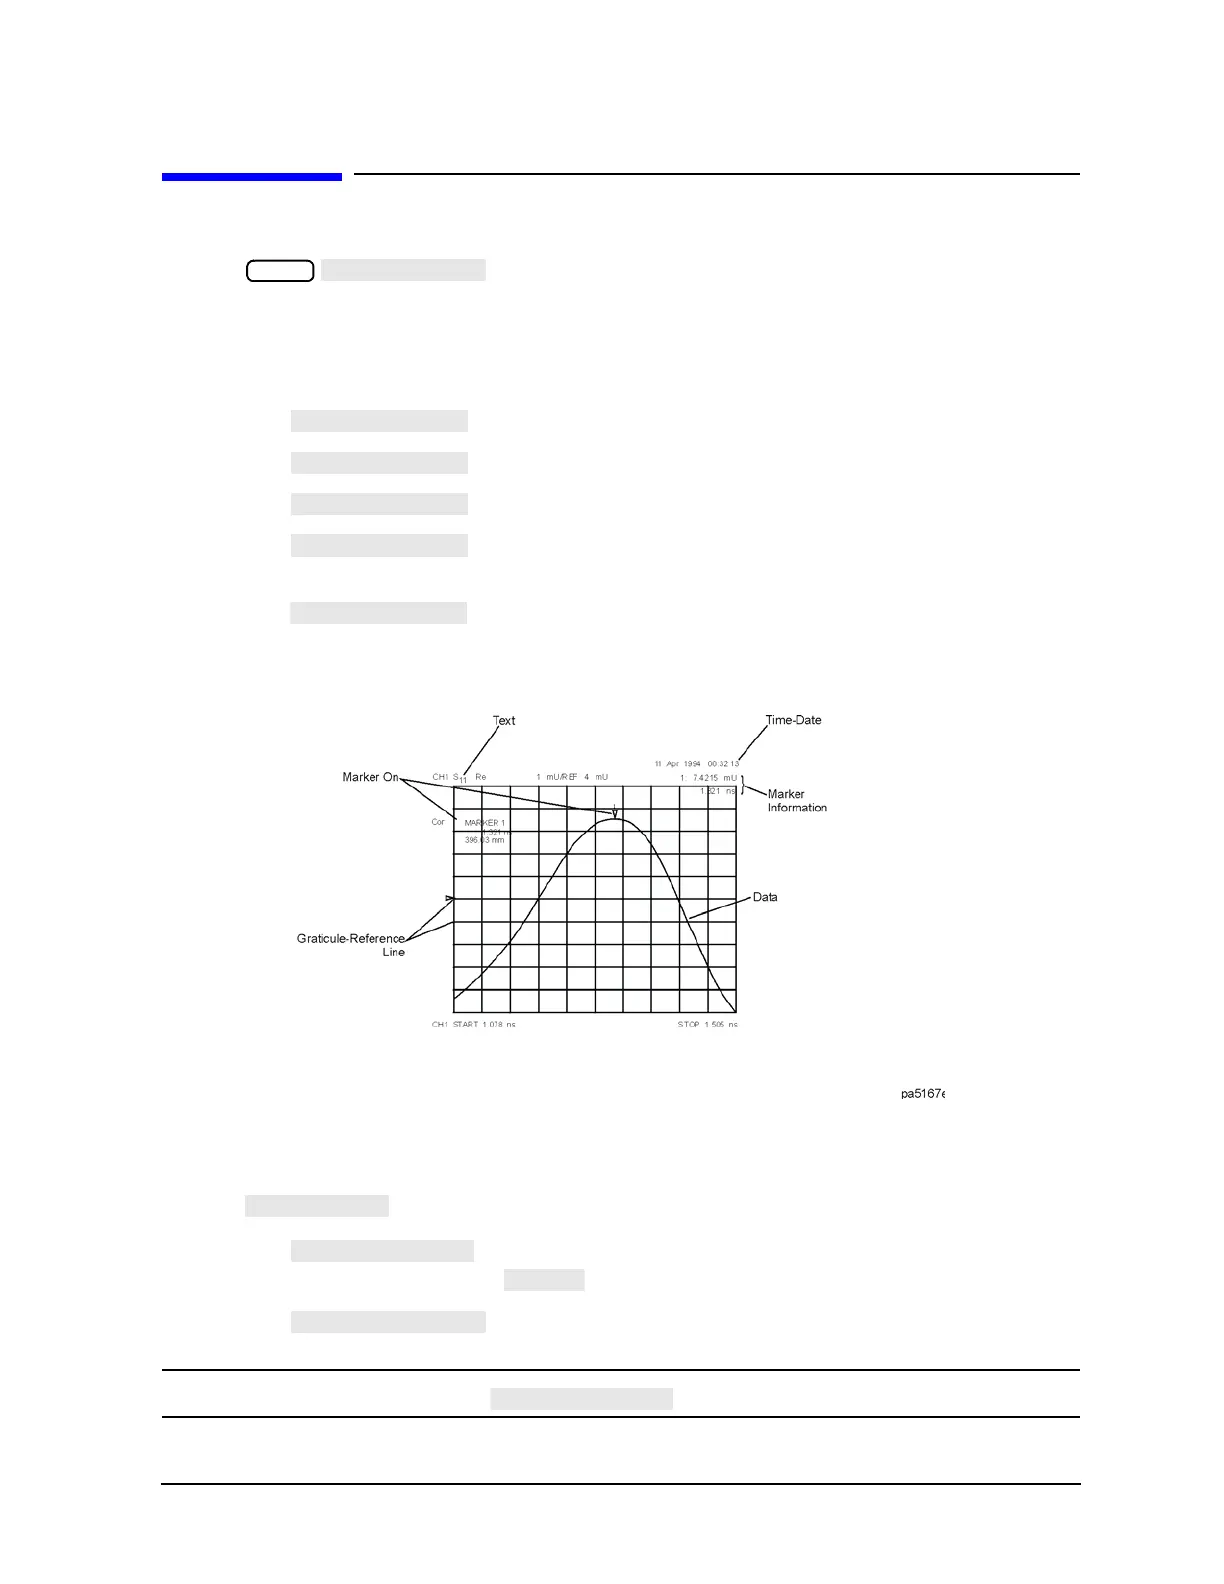
Choosing Display Elements
• Choose which of the following measurement display elements that you want to appear on your plot:
❏ Choose if you want the measurement data trace to appear on your plot.
❏ Choose if you want the displayed memory trace to appear on your plot.
❏ Choose if you want the graticule and the reference line to appear on your plot.
❏ Choose if you want all of the displayed text to appear on your plot. (This does
not include the marker values or softkey labels.)
❏ Choose if you want the displayed markers, and marker values, to appear on your
plot.
Figure 4-5 Plot Components Available through Definition
Selecting Auto-Feed
• Press until the correct choice is highlighted.
❏ Choose if you want a “page eject” sent to the plotter or HPGL compatible
printer after each time you press .
❏ Choose if you want multiple plots on the same sheet of paper.
NOTE The peripheral ignores when you are plotting to a quadrant.

 Loading...