5- 17
Optimizing Measurement Results
Reducing Noise
Noise Floor Plot
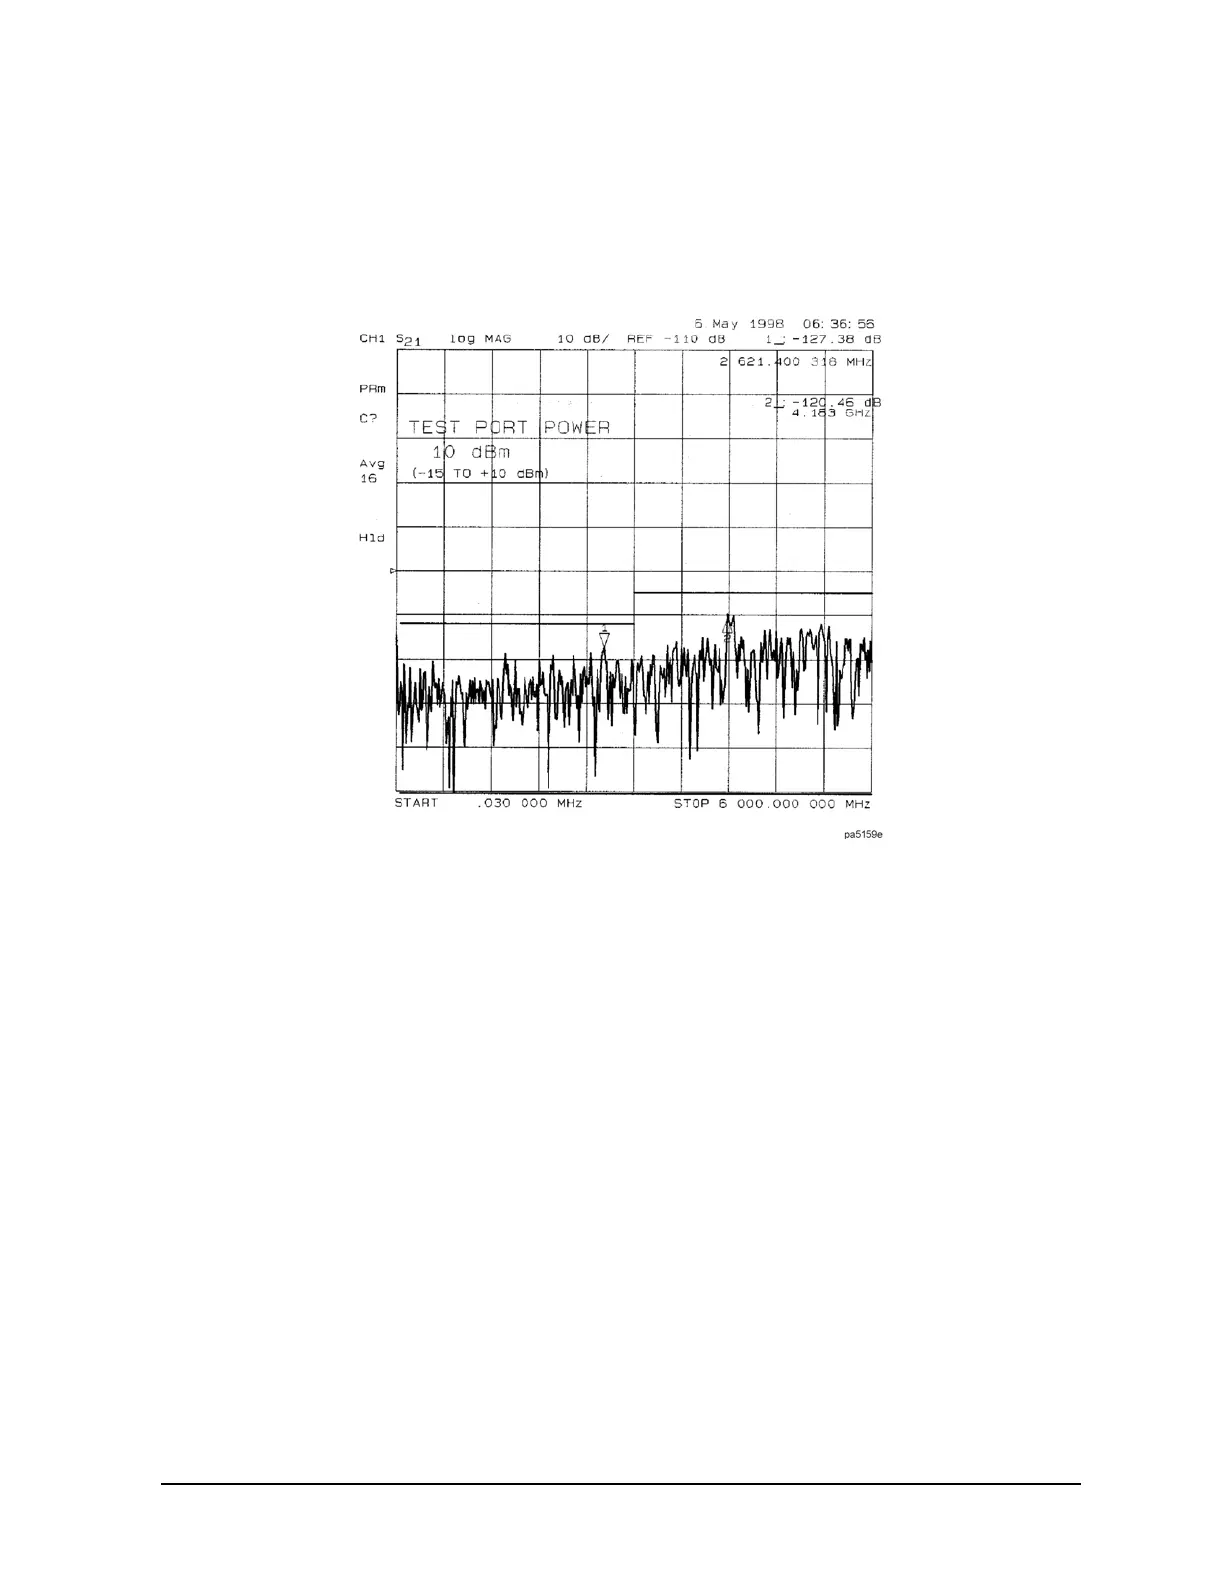
Figure 5-2 shows the noise floor with the B sampler and PORT 2 SWITCH/ COUPLER port jumpers
positioned to increase the dynamic range of the analyzer.
Figure 5-2 Noise Floor Plot
System Parameters
• Full two port calibration
•401 points
•10 Hz IF BW
•Averaging ON
• Averaging factor 128
•RF power level 10 dBm
• RF power increased to +10 dBm after calibration
•50 terminations on Test Ports 1 and 2

 Loading...