1-46
Making Measurements
Measuring Electrical Length and Phase Distortion
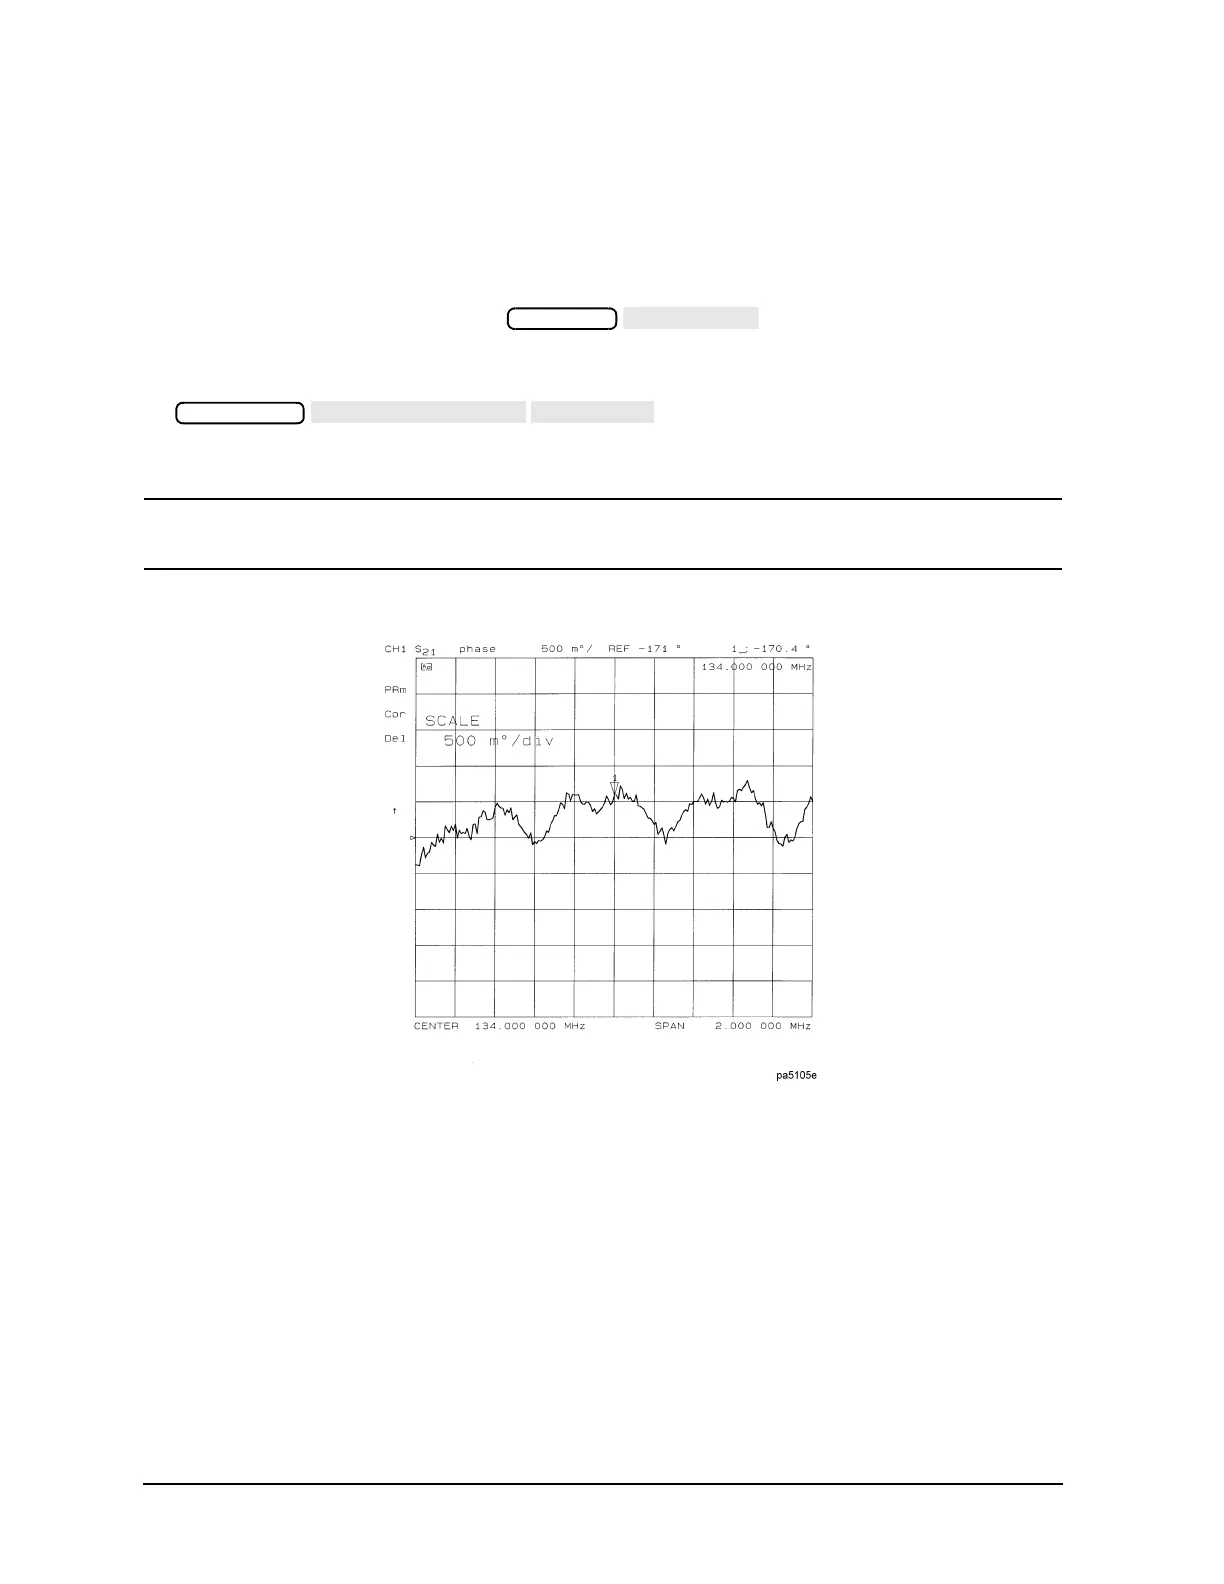
Deviation From Linear Phase
By adding electrical length to “flatten out” the phase response, you have removed the linear phase shift
through your device. The deviation from linear phase shift through your device is all that remains.
1. Follow the procedure in "Measuring Electrical Length" on page 1-43.
2. To increase the scale resolution, press and turn the front panel knob, or
enter a value from the front panel keypad.
3. To use the marker statistics to measure the maximum peak-to-peak deviation from linear phase, press
.
4. Activate and adjust the electrical delay to obtain a minimum peak-to-peak value.
NOTE It is possible to use delta markers to measure peak-to-peak deviation in only one portion of
the trace. See "To Calculate the Statistics of the Measurement Data" on page 1-41.
Figure 1-36 Deviation from Linear Phase Example Measurement
Group Delay
The phase linearity of many devices is specified in terms of group or envelope delay. The analyzer can
translate this information into a related parameter, group delay. Group delay is the transmission time
through your device under test as a function of frequency. Mathematically, it is the derivative of the phase
response which can be approximated by the following ratio:
/(360 )
where is the difference in phase at two frequencies separated by F. The quantit y F is commonly called
the “aperture” of the measurement. The analyzer calculates group delay from its phase response
measurements.
The default aperture is the total frequency span divided by the number of points across the display (i.e. 201

 Loading...