142
S:\Hp8960\Generic Documents\Manual Operation Getting Started Guide\Pi_manual operation getting started guide\chapters\gsm_man_measurements.fm
GSM Mobile Measurements
You can zoom in to individual sections of the graph by pressing the Full (F1),
Rising Edge (
F2), Falling Edge (F3), or Useful (F4) keys. In addition, you can
control a marker or change axis values by pressing the Graph Control (
F5) key.
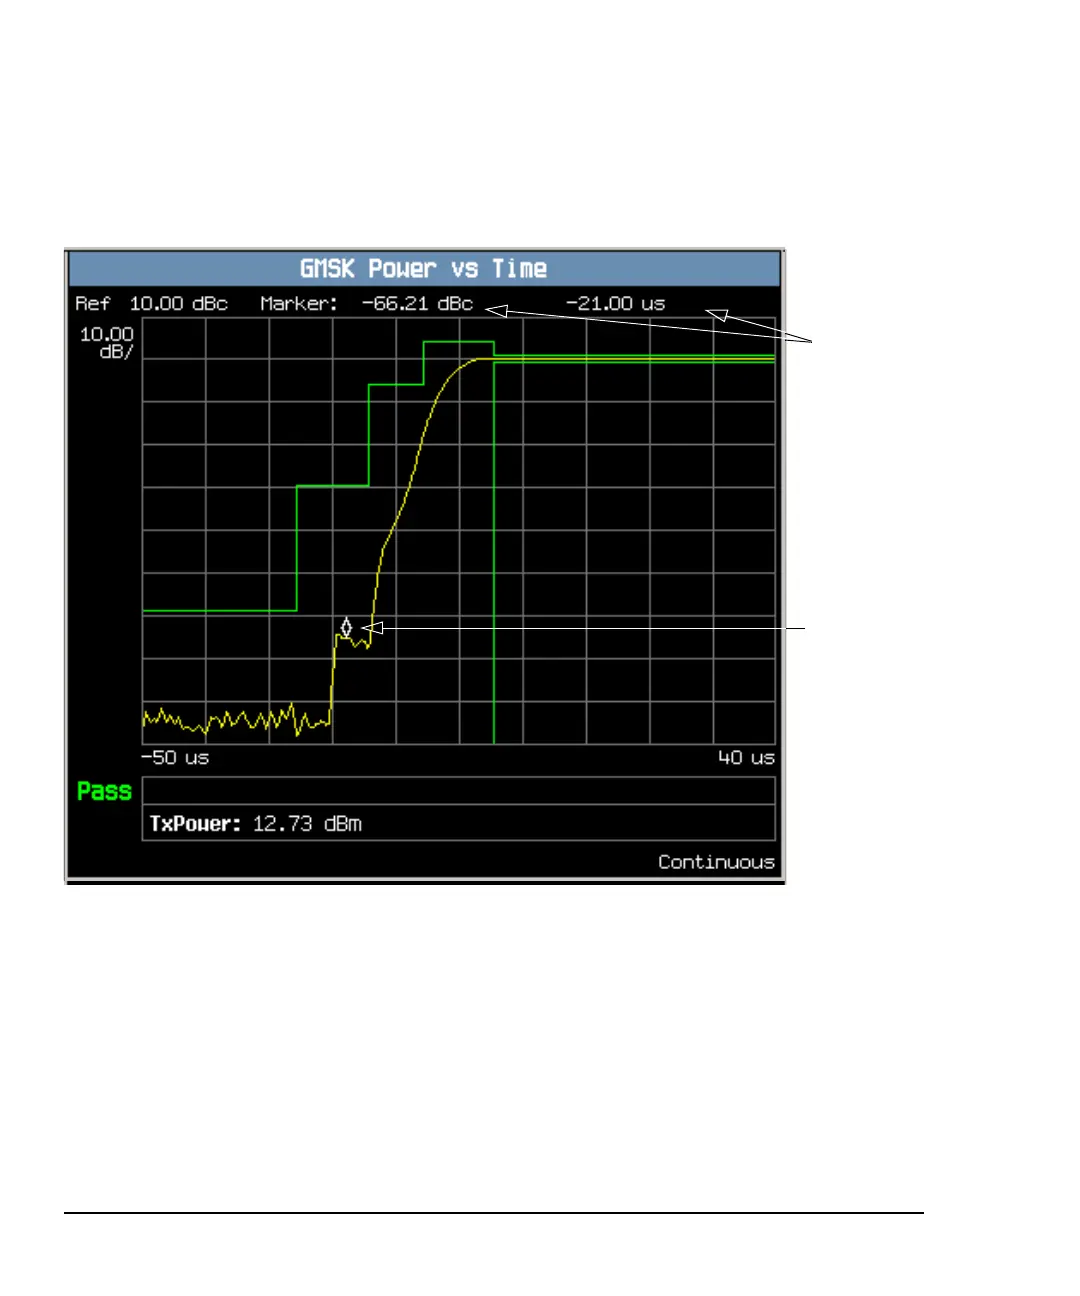
A typical graph view of the rising edge of the burst is shown above. You can access
this view by pressing the Rising Edge (
F2) key.
In this case, the marker is turned on and positioned on the rising edge. The
marker can be turned on by pressing the Graph Control (F5) key then the Marker
Position (
F2) key. Set the required marker position using the knob or the
numeric entry keys. The signal level at the marker and its position along the
x-axis are shown at the top of the display above the graph.
If you require details on how to navigate through the Power versus Time graph
menus, see “Power versus Time Graph Menus” on page 143.
Marker
signal
level and
position
along the
x-axis
Marker
indicator
 Loading...