146
S:\Hp8960\Generic Documents\Manual Operation Getting Started Guide\Pi_manual operation getting started guide\chapters\gsm_man_measurements.fm
GSM Mobile Measurements
NOTE When the Multi-Measurement Count parameter is set to a number
greater than 1, it is possible for some, or all of the individual pass/fail
indicators to show a pass while the overall pass/fail indicator shows a
fail. This is because the individual pass/fail indicators relate to the last
of the multi-measurements made, whereas the overall measurement
pass/fail indicator is an accumulative result from all the
multi-measurements made.
The marker can be turned on by pressing the Graph Control (
F5) key then the
Marker Position (
F2) key. Set the required marker position using the knob or the
numeric entry keys. In addition, the axis values can be changed by pressing the
Axis Control (
F1) key. This allows you to zoom in or out to look at particular
sections of the graph in more detail.
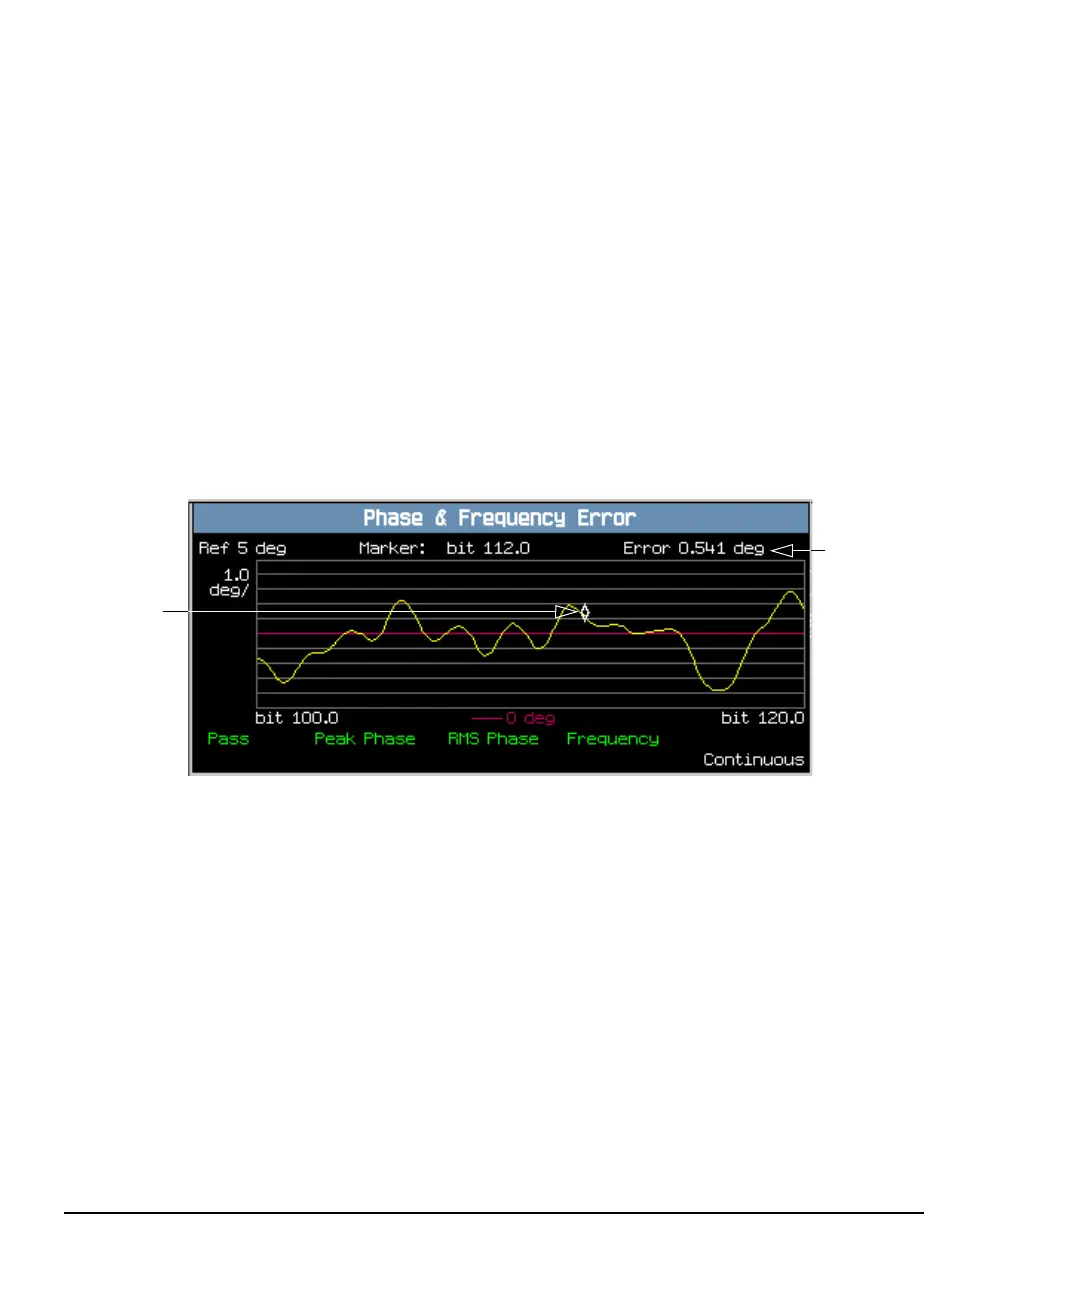
A typical peak phase error graph is shown above. This graph is zoomed in to show
bits ranging from 100.0 to 120.0 at a 1.0 degrees per division setting. The Y-axis
reference point is changed to 5.0 degrees.
In this case, the marker is turned on and positioned at bit 112. The phase error at
the marker and its bit position are shown at the top of the display above the graph.
If you require details on how to navigate through the phase and frequency error
graph menus, see “Phase and Frequency Error Graph Menus” on page 147.
Marker
phase
error
and bit
position
Marker
indicator
 Loading...