157
S:\Hp8960\Generic Documents\Manual Operation Getting Started Guide\Pi_manual operation getting started
GSM Mobile Measurements
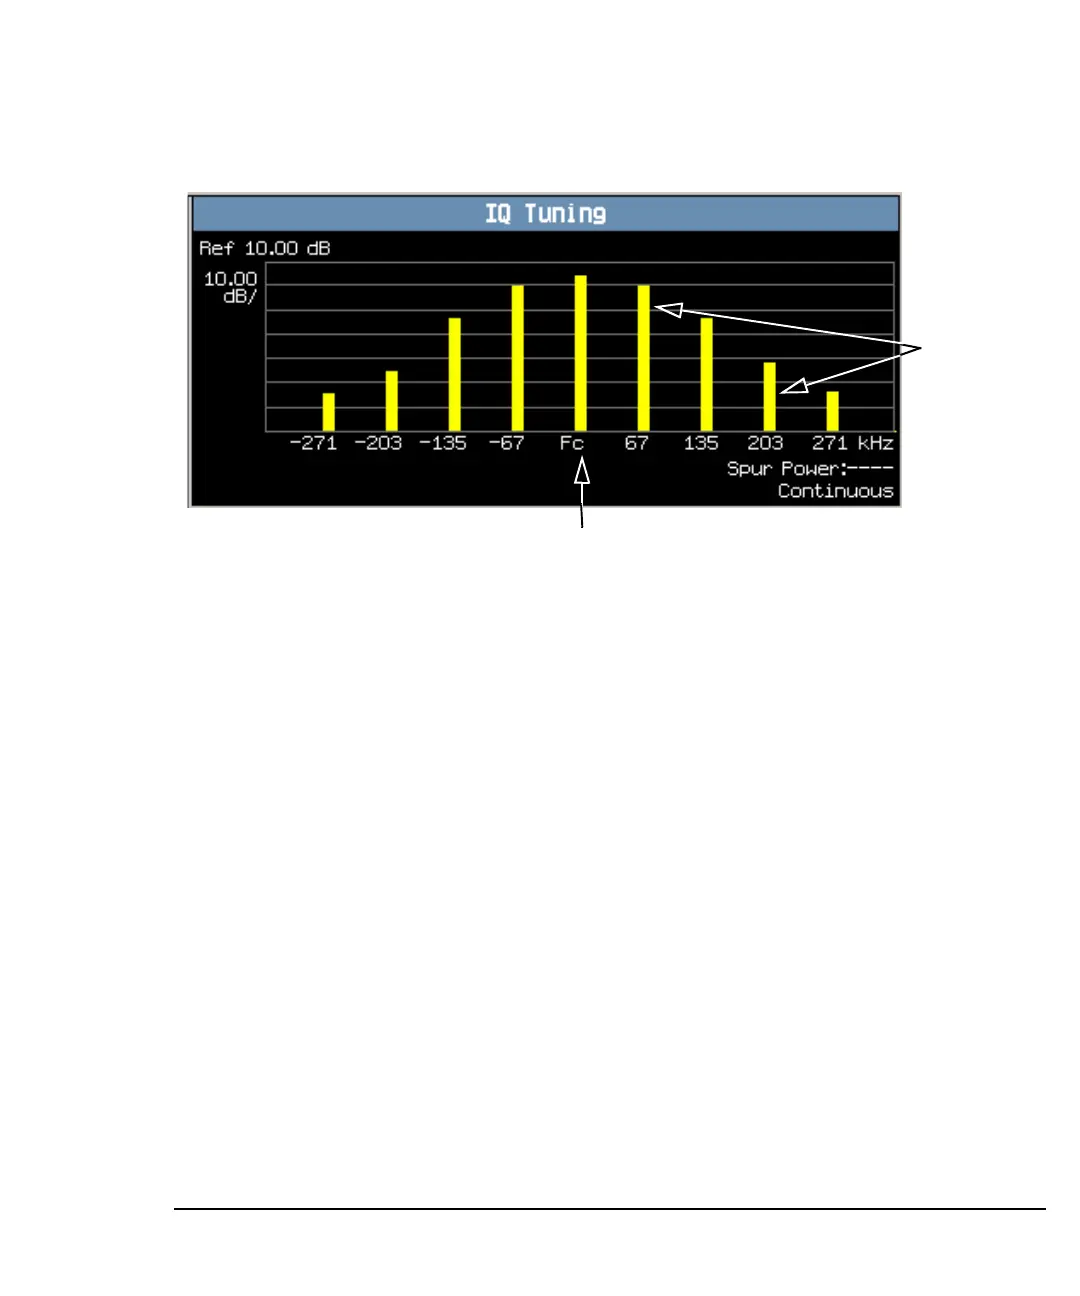
10.Press the Graph (F2) key to access the IQ Tuning bar graph.
A typical IQ Tuning graph is shown above. On the display, the bar representing
each offset and the carrier frequency (Fc) is shown in yellow.
If you require details on how to navigate through the Output RF Spectrum graph
menus, see “IQ Tuning Graph Menus” on page 158.
Frequency
offsets
Carrier
frequency
 Loading...