4-68 | Model 933S UV Analyzer
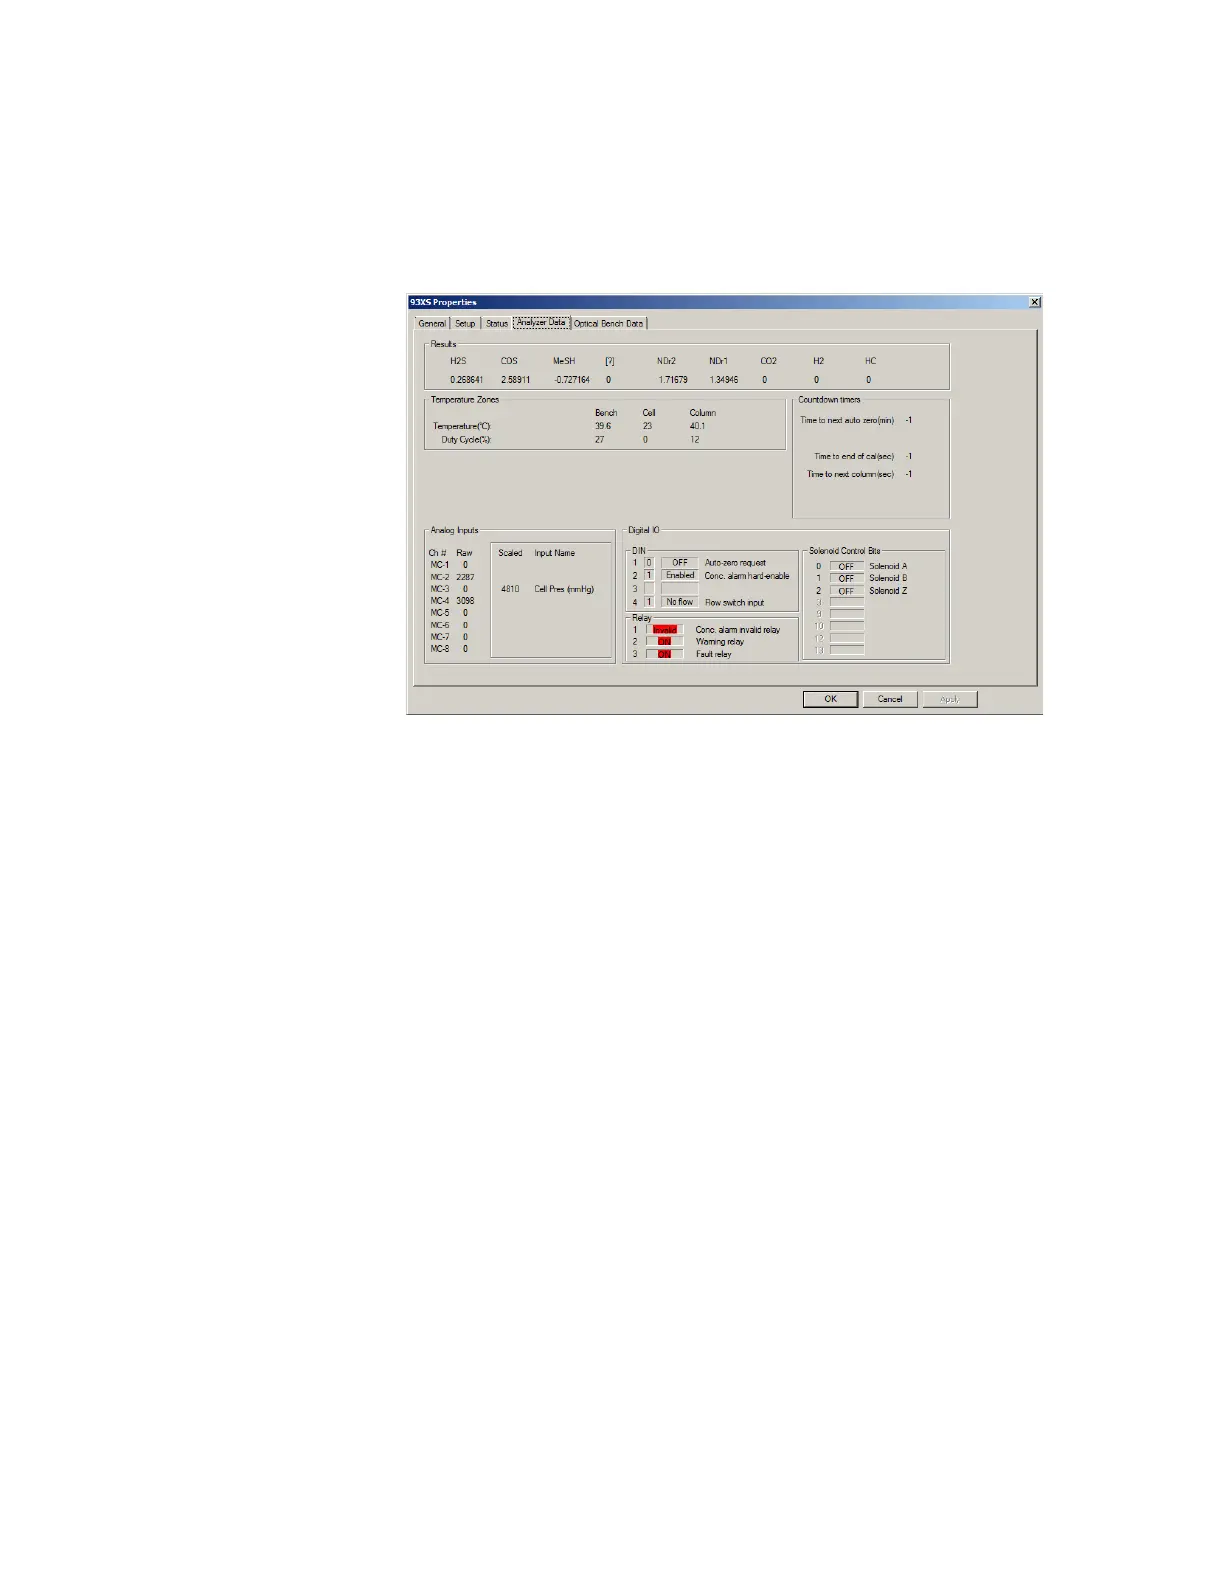
Analyzer Data Tab
The Analyzer Data tab displays live data results of up to six species of
gases plus other components (depends on analyzer model), and live data
results of each temperature zone, analog inputs/outputs, and digital in-
puts/outputs.
Figure 4-24.
Analyzer Data tab.
Results
Displays each gas species being measured and their live values (up-
dated at one-second intervals).
This information is also displayed in the Display field on the Optical
Bench, Gas Calibration, and Info dialog boxes, and Status tab.
Temperature Zones
Displays the real-time Temperature (°C) and Duty Cycle (%) of each
temperature zone:
• Bench (Optical Bench)
• Cell (Measuring Cell)/Oven (optional)
• Column (Column Block)
 Loading...