4 - 20
Test 3 - Full load testing (phase to neutral)
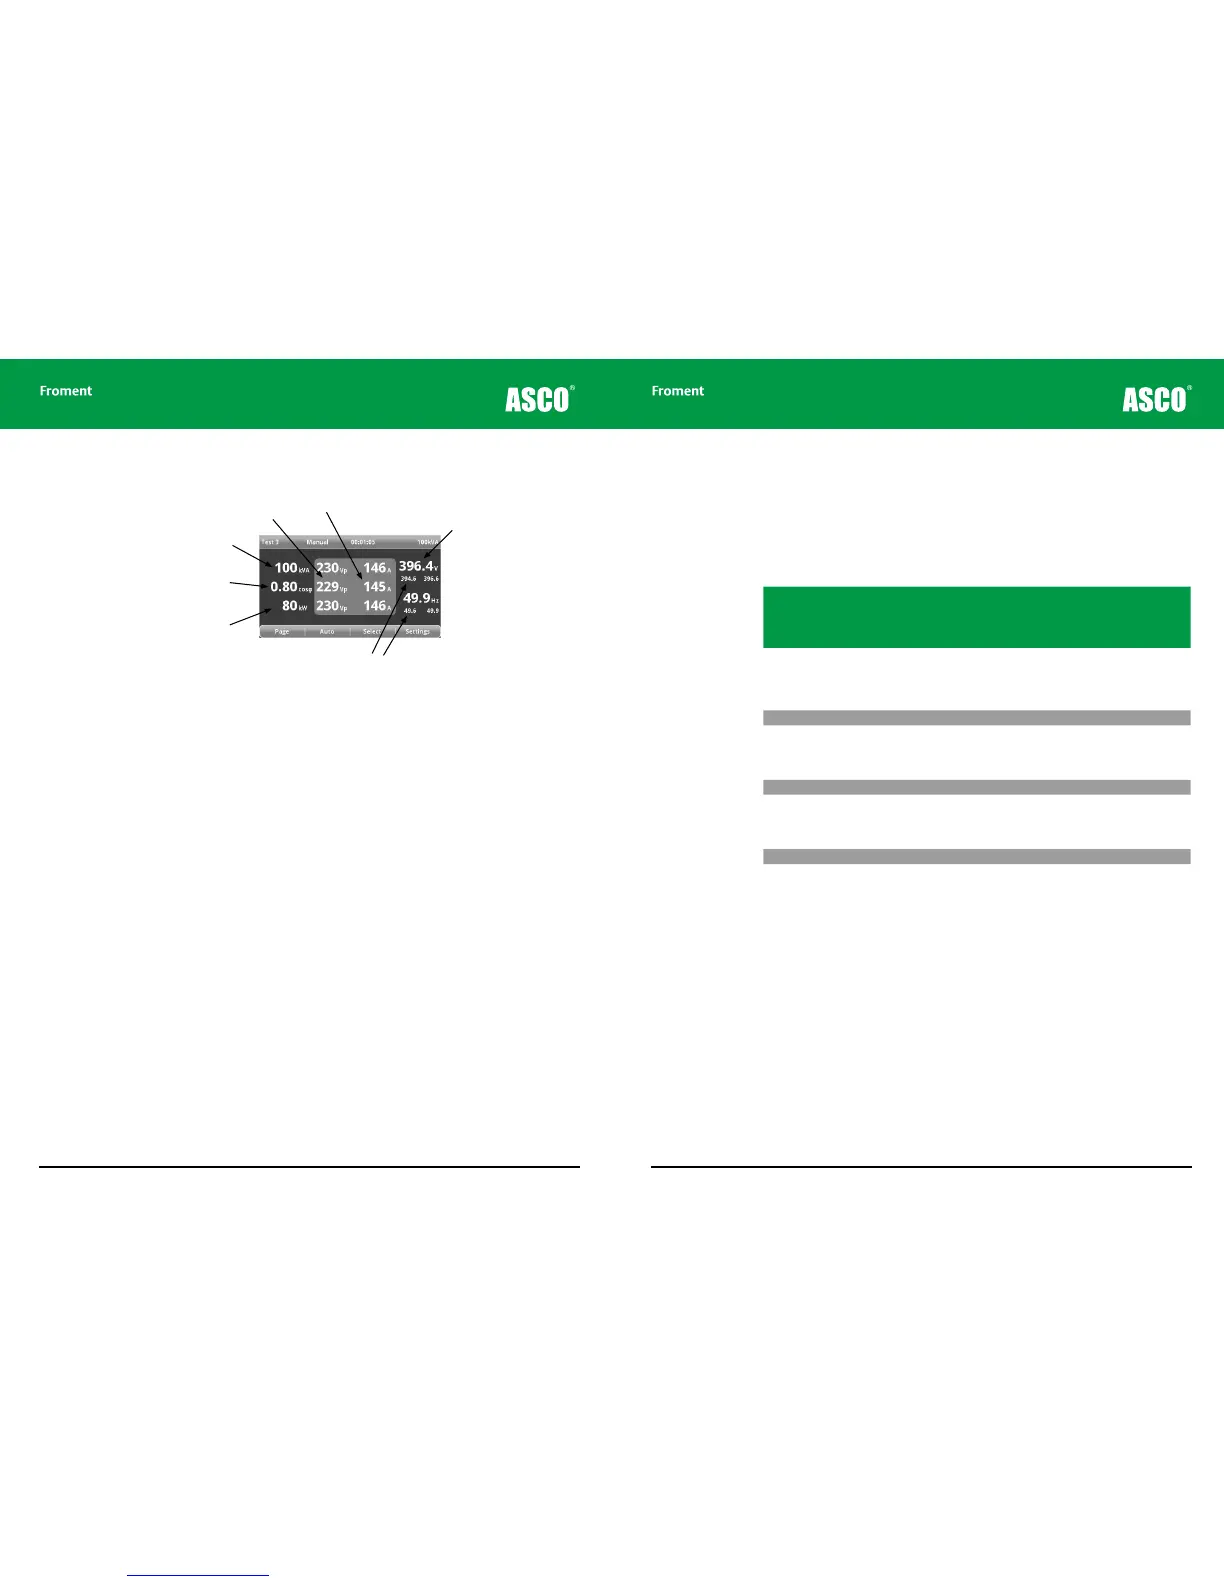
Figure 4-17 Test 3 page.
Test 3 displays true rms three-phase measurements of the phase to neutral voltage (VP),
and current (A) in the central column of the display. Again, the calculated instrumentation
powers are shown in the left hand column.
Apparent Power
Power Factor
Actual Power
Real-time voltage and
frequency display
RMS line to line voltage
RMS Current
Maximums and minimums
Hand-held Reference Guide
4 - 21
Assessing supply performance
The voltage and frequency maximum and minimums and transient response graphs can
be used to assess the performance of the Supply-on-Test.
ISO8528 defines three classes of generator performance (G1, G2 and G3) and specifies
deviations and recovery times for each class as follows:
The generator class will be indicated on rating plate. For example, in Figure 4-8 the
generating set is rated G3 (ISO8528 - 3 Rating).
Operating Limit Values
Performance class
Parameter Unit G1 G2 G3
Transient fre-
quency devia-
tion from rated
frequency
100% sudden
power decrease
% <= +18 <= +12 <= +10
Sudden power
increase
% <= -15 <= -10 <= -7
Frequency
recovery time
100% sudden
power decrease
s <= 10 <= 5 <= 3
Sudden power
increase
s <= 10 <= 5 <= 3
Transient volt-
age deviation
100% sudden
power decrease
% <= +35 <= +25 <= +20
Sudden power
increase
% <= -25 <= -20 <= -15
Voltage recov-
ery time
100% sudden
power decrease
s <= 10 <= 6 <= 4
Sudden power
increase
s <= 10 <= 6 <= 4
Chapter Four