CHAPTER 4 REFERENCE GUIDE
EFD1000 PRO MAX PFD Pilot’s Guide
Page 4-73
091-00005-002 ()
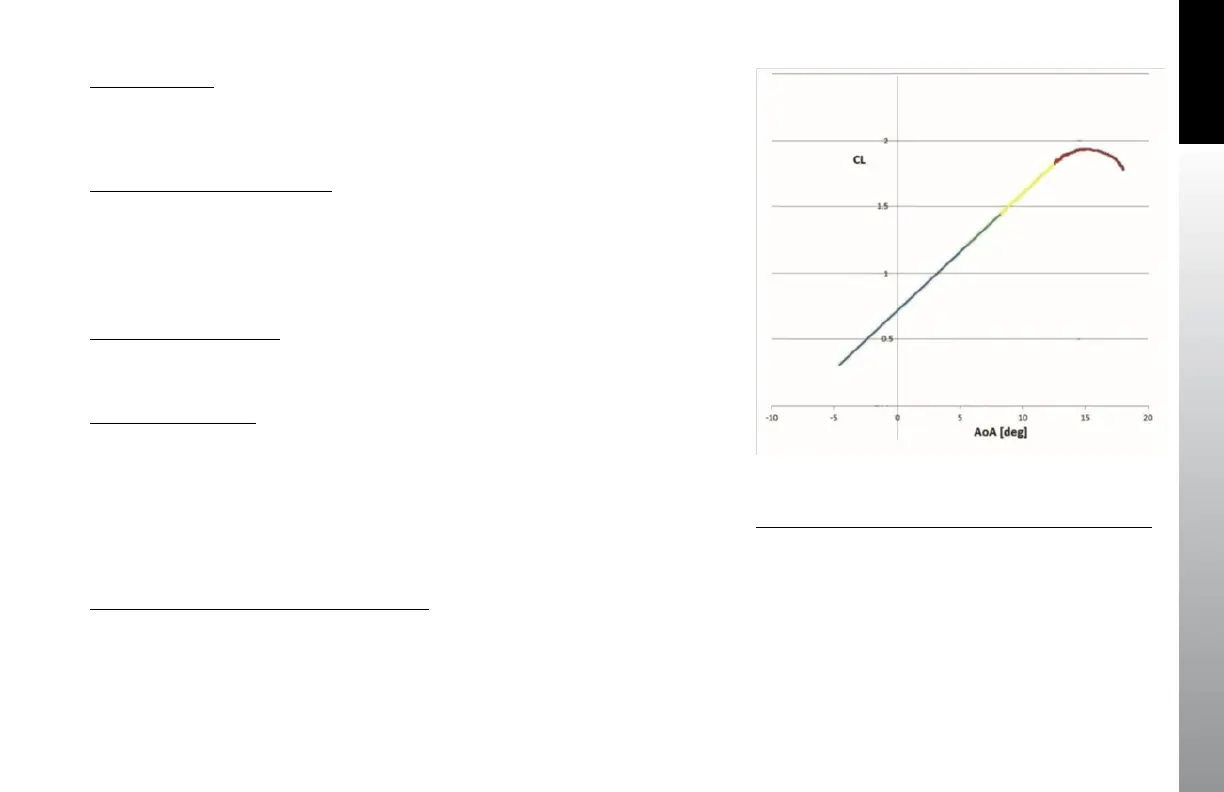
Figure 4-115
Display Color Bands VS Coefficient of Lift
Low AOA (Blue)
When the pointer is in the Blue color band the aircraft is at a low angle of attack. This
would most frequently be seen during normal or cruise flight.
Normal Approach AOA (Green)
When the pointer is in the Green color band, the AOA is indicating a normal approach
stall margin. With the Flaps DOWN (Figure 4-114) this occurs when the aircraft is at an
AOA lower or equal to the minimum approach stall margin, which is typically near 1.3
V
SO
The stall margin is greater than the short field approach stall margin
1.
Green / Yellow transition
Approximately the short field approach AOA
1
Caution AOA (Yellow)
When the pointer is in the Yellow color band, the AOA is indicating a reduced stall
margin. Cautioning you the current AOA is greater than normal and that should the
AOA trend continue to increase it could result in entering the Yellow - Black Cross Hatch
or Warning AOA region.
The stall margin is less than the short field approach stall margin
1
Yellow / Yellow -Black Cross Hatch transition
Correlates approximately to the stall warning horn
1. Stall margin at one g, maximum gross weight, zero bank angle, no accelera-
tion. An approximate value due to calibration, weight, and calibrated vs indi-
cated airspeed errors. If the short eld approach speed is not presented in the
Airplane Flight Manual the normal approach speed is used. The instruction for
Continued Airworthiness contain the calibration information for the airplane.