71
NOTE
Status parameters, such as a switch reading like ON, OFF, ACTIVE, and ABORT, can
only be displayed in Text Mode. Value parameters, such as a sensor reading, can be
displayed in both text and graph modes.
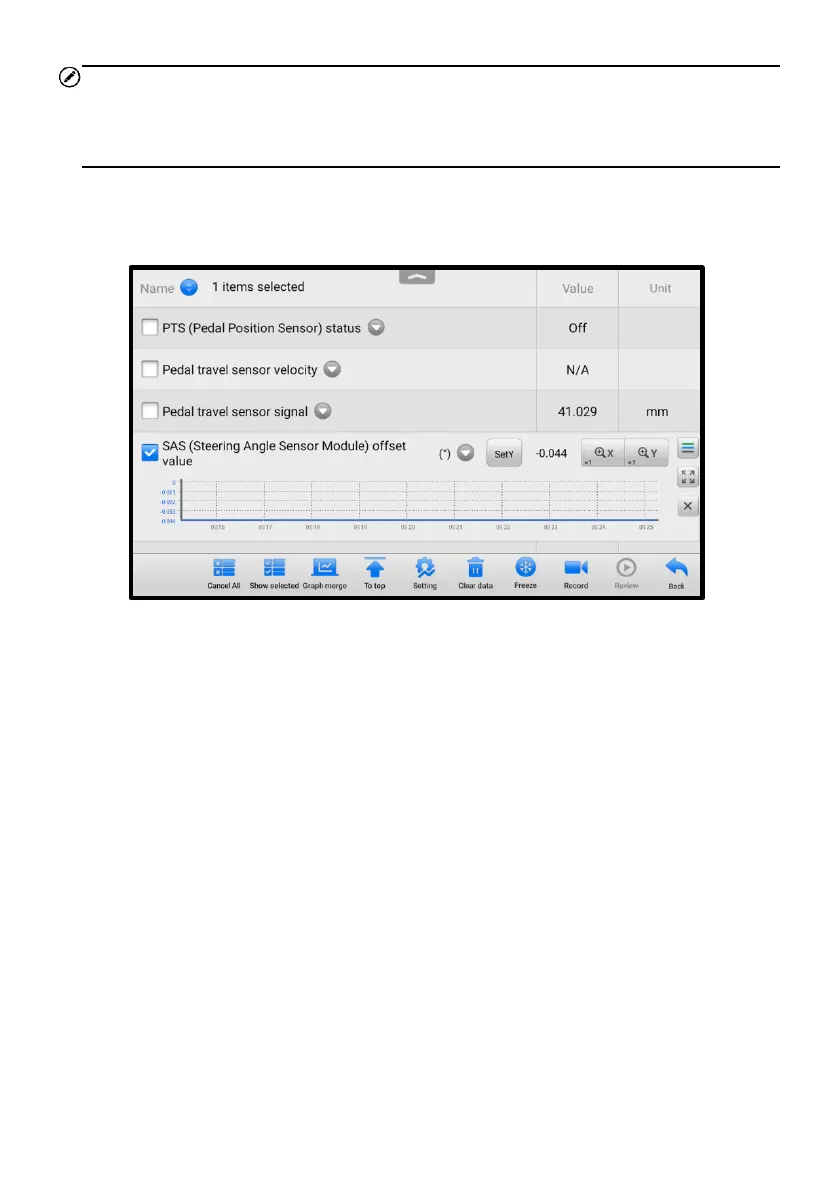
◆ Waveform Graph Mode — displays the parameters in waveform graphs. In this
mode, five control buttons will display on the right side of the parameter item,
allowing you to manipulate the display status.
Figure 5-18 Waveform Graph Mode Screen
a) Settings Button (SetY) — sets the minimum and maximum value of the Y
axis.
b) Scale Button — changes the scale values.
There are two scale buttons displayed above the waveform graph, which can be
used to change the scale values of the X axis and Y axis of the graph. There are
four scales available for the X axis: x1, x2, x4, and x8. And there are three scales
available for the Y axis: x1, x2, and x4.
c) Edit Button — edits the waveform color and the line thickness.
d) Zoom-in Button — tap once to display the selected data graph in full screen.
e) Exit Button — tap to exit the waveform graph mode.
Full Screen Display — this option is only available in the waveform graph mode,
and mostly used in Graph Merge status for data comparison. There are four control
buttons available on the top-right side of the screen under this mode.
⚫ Scale Button — tap to change the scale values below the waveform graph.
There are four scales available for the X axis: x1, x2, x4, and x8. And there are