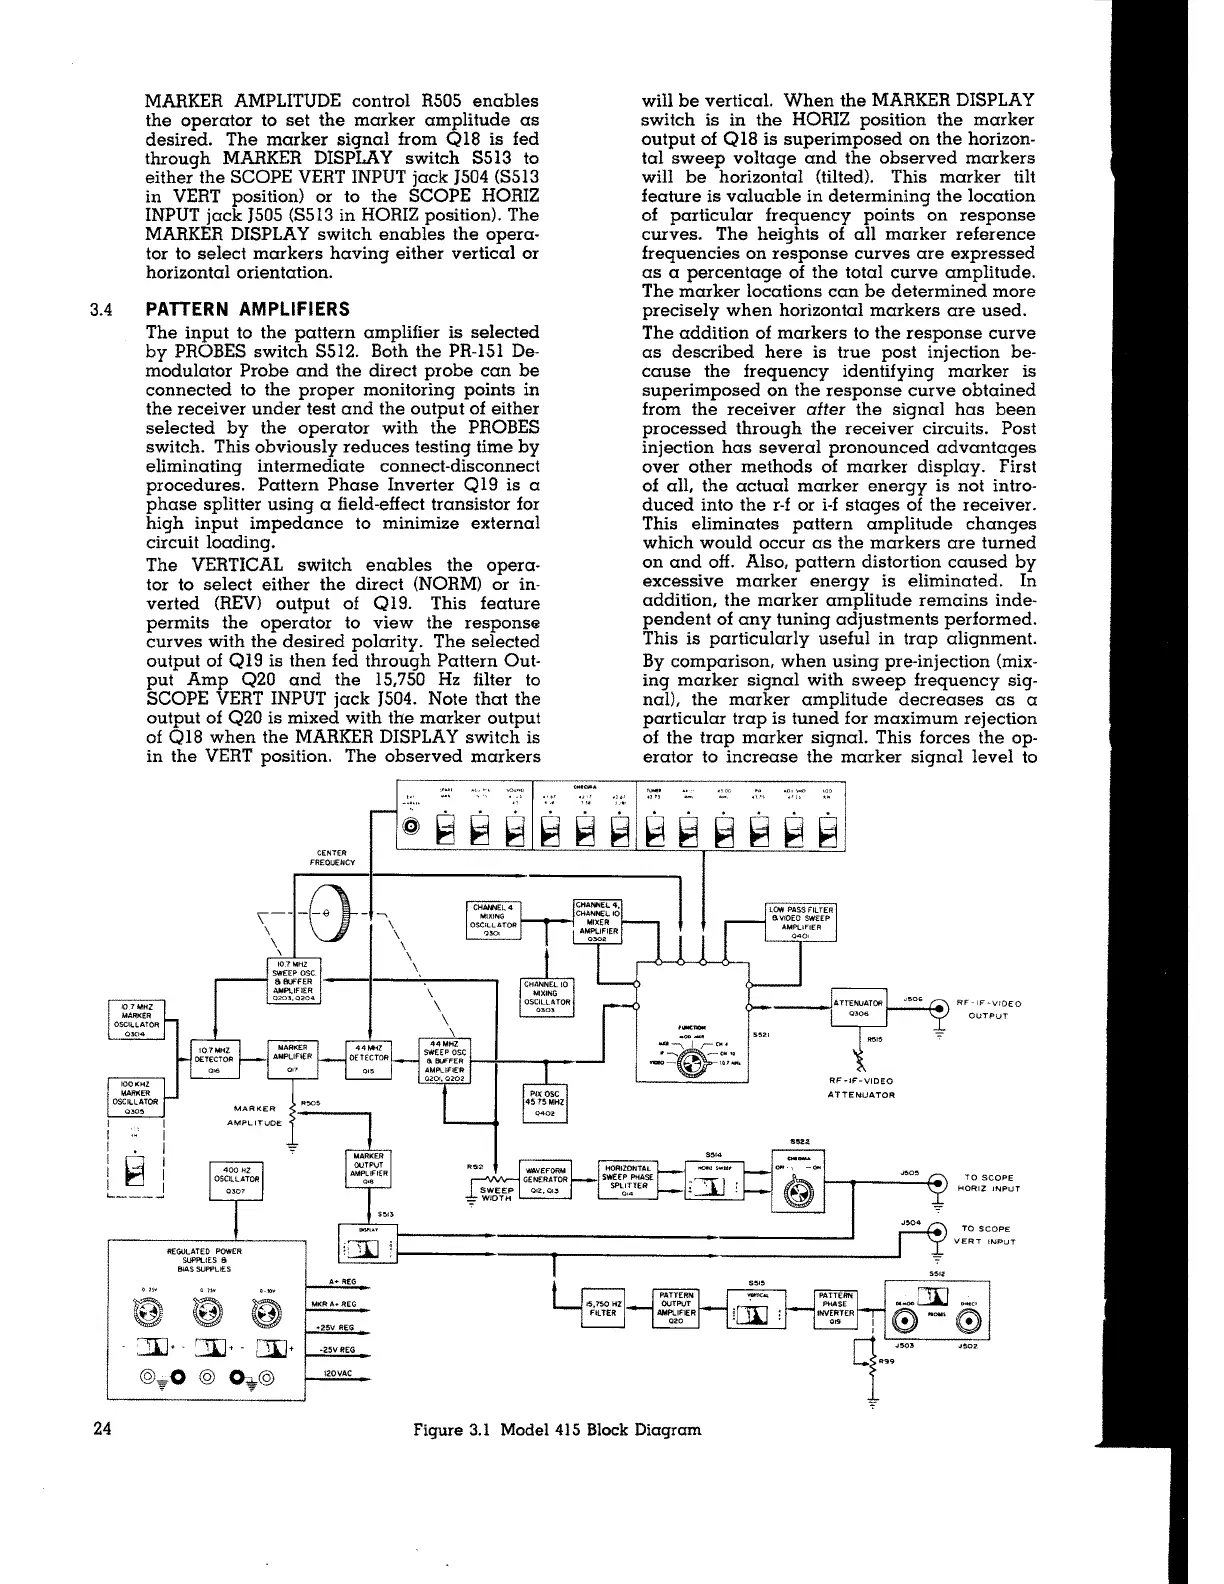
3.4
MARKER AMPLITUDE control R505 enables
the operator to set the marker amplitude as
desired. The marker signal from Ql8 is fed
through MARKER DISPLAY switch S513 to
either the SCOPE VERT INPUT jack J504 (S513
in VERT position) or to the SCOPE HORIZ
INPUT jack J505 (S5I3 in HORIZ position). The
MARKER DISPLAY switch enables the opera-
tor to select markers having either vertical or
horizontal orientation.
PATIERN AMPLIFIERS
The input to the pattern amplifier is selected
by PROBES switch S512. Both the PR-151 De-
modulator Probe and the direct probe can be
connected to the proper monitoring points in
the receiver under test and the output of either
selected by the operator with the PROBES
switch. This obviously reduces testing time by
eliminating intermediate connect-disconnect
procedures. Pattern Phase Inverter Q 19 is a
phase splitter using a field-effect transistor for
high input impedance to minimize external
circuit loading.
The VERTICAL switch enables the opera-
tor to select either the direct (NORM) or in-
verted (REV) output of Ql9. This feature
permits the operator to view the
response
curves with the desired polarity. The selected
output of Ql9 is then fed through Pattern Out-
put Amp Q20 and the 15,750 Hz filter to
SCOPE VERT INPUT jack J504. Note that the
output of Q20 is mixed with the marker output
of QI8 when the MARKER DISPLAY switch is
in the VERT position. The observed markers
I
I
• I
MARKER
AMPLITUDE
CENTER
FREQUE:NCY
I~:
I I
1,,_ ___ __.
will be vertical. When the MARKER DISPLAY
switch is in the HORIZ position the marker
output of Ql8 is superimposed on the horizon-
tal sweep voltage and the observed markers
will be horizontal (tilted). This marker tilt
feature is valuable in determining the location
of particular frequency points on response
curves. The heights of all marker reference
frequencies on response curves are expressed
as a percentage of the total curve amplitude.
The marker locations can be determined more
precisely when horizontal markers are used.
The addition of markers to the response curve
as described here is true post injection be-
cause the frequency identifying marker is
superimposed on the response curve obtained
from the receiver after the signal has been
processed through the receiver circuits. Post
injection has several pronounced advantages
over other methods of marker display. First
of all, the actual marker energy is not intro-
duced into the r-f or i-f stages of the receiver.
This eliminates pattern amplitude changes
which would occur as the markers are turned
on and off. Also, pattern distortion caused by
excessive marker energy is eliminated. In
addition, the marker amplitude remains inde-
pendent of any tuning adjustments performed.
This is particularly useful in trap alignment.
By comparison, when using pre-injection (mix-
ing marker signal with sweep frequency sig-
nal), the marker amplitude decreases as a
particular trap is tuned for maximum rejection
of the trap marker signal. This forces the op-
erator to increase the marker signal level to
HORtZONlAL
SW££P PHASE
SPLITTER
0<4
LON PASS f"IL TER
6Vl0EO SWEEP
AMPUFIER
RF-IF-VIDEO
ATTENUATOR
RF- IF-V!DEO
OUTPUT
TO SCOPE
HORIZ INPUT
TO SCOPE
REGULATED POWER
SUPPUES 8
BJAS SUPPLIES
n
•o•
t-----·---?---------·--------__J °? VERT INPUT
24
A+ REG
MKRA• REG
+25V REG
·25VREG
!2.0VAC
°'_cm _er
:0 0
...
q
""'
Figure 3.1 Model 415 Block Diagram