11.1.1. ll Remove the direct cable connection from
the i-f alignment test point and reconnect it
to the discriminator or detector test point as
specified in the alignment instructions. A
typical discriminator
"S" -curve is shown in
Fig. 11.2. The discriminator bandwidth re-
quirements vary among manufacturers.
The use of the 100 KHz markers enables
the operator to identify any bandwidth re-
quired. In addition, it is possible to inter-
polate between the 100 KHz markers to
obtain additional frequency resolutions
when performing i-f and discriminator align-
ments.
10.7 MHZ
CRYSTAL MARKER
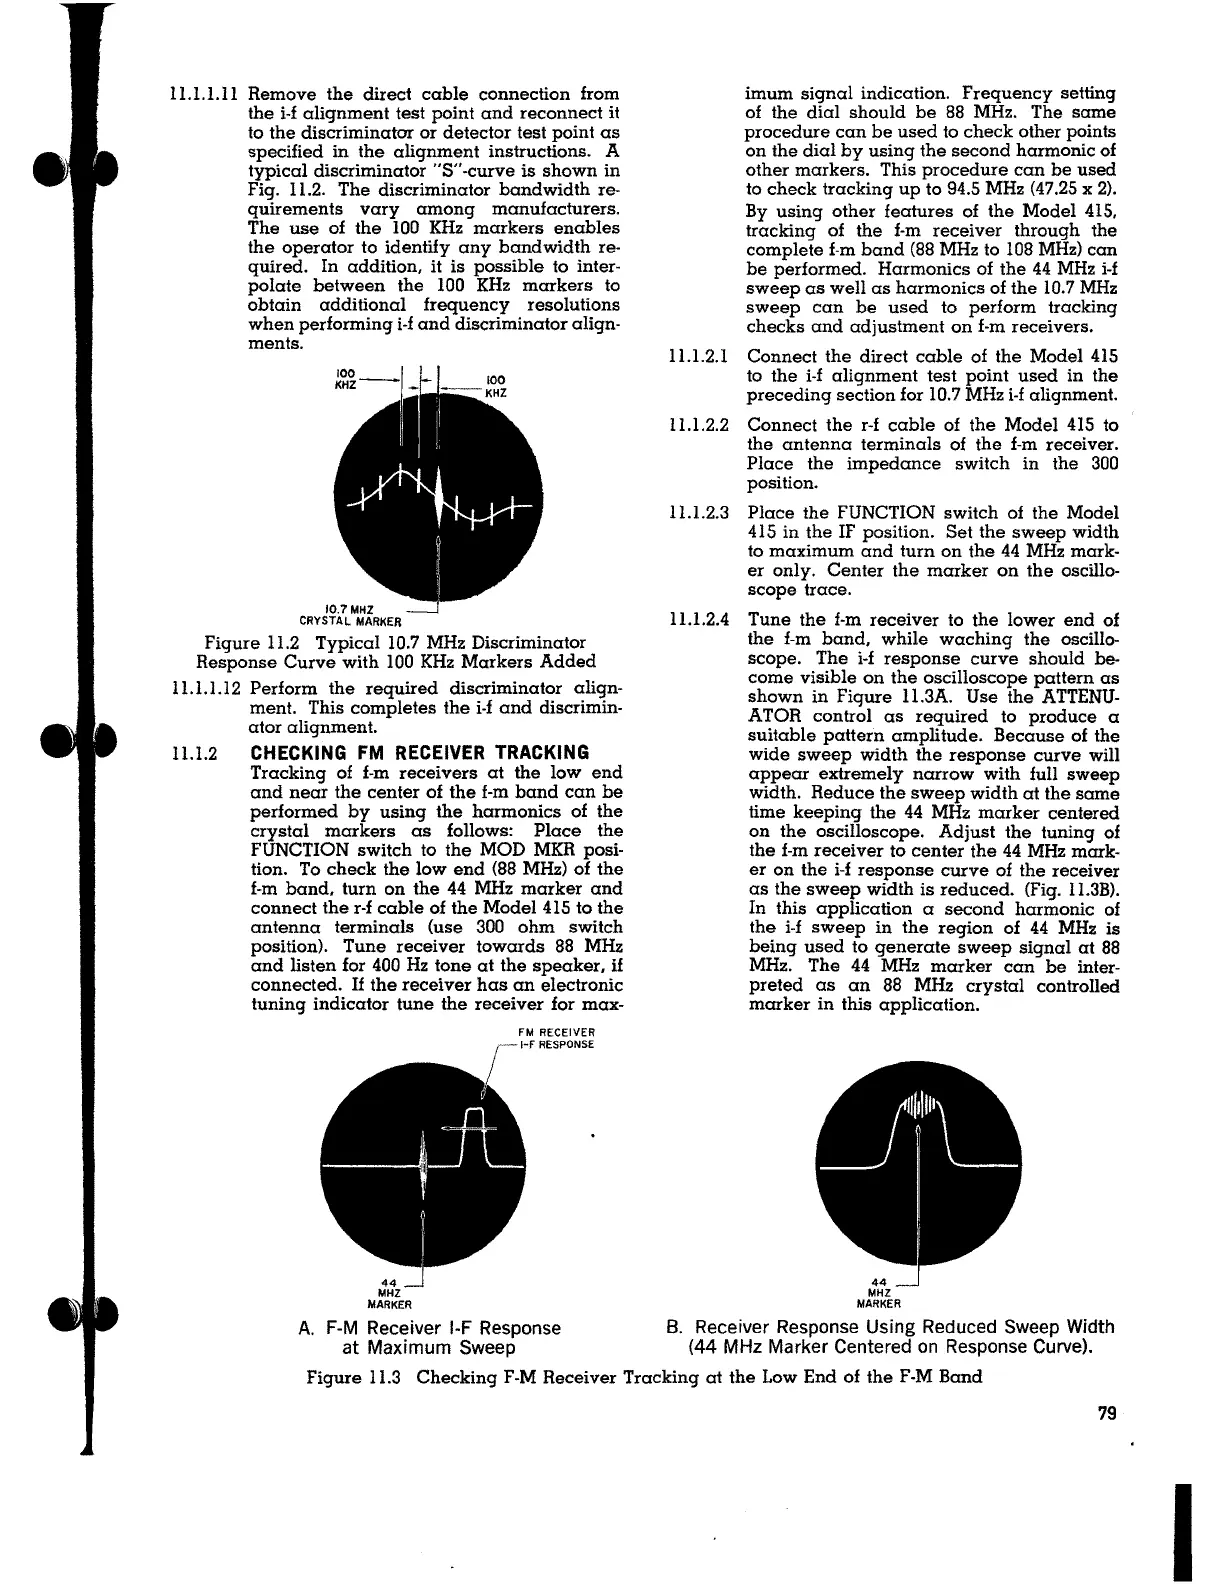
Figure 11.2 Typical 10.7 MHz Discriminator
Response Curve with 100 KHz Markers Added
11.1.1.12 Perform the required discriminator align-
ment. This completes the i-f and discrimin-
ator alignment.
11.1.2 CHECKING FM RECEIVER TRACKING
Tracking of f-m receivers at the low end
and near the center of the f-m band can be
performed by using the harmonics of the
crystal markers as follows: Place the
FUNCTION switch to the MOD MKR posi-
tion. To check the low end (88 MHz) of the
f-m band, turn on the 44 MHz marker and
connect the r-f cable of the Model 415 to the
antenna terminals (use 300 ohm switch
position). Tune receiver towards 88 MHz
and listen for 400 Hz tone at the speaker,
if
connected. If the receiver has an electronic
tuning indicator tune the receiver for max-
FM RECEIVER
1-F RESPONSE
A. F-M Receiver 1-F Response
at Maximum Sweep
imum signal indication. Frequency setting
of the dial should be 88 MHz. The same
procedure can be used to check other points
on the dial by using the second harmonic of
other markers. This procedure can be used
to check tracking up to 94.5 MHz (47.25 x 2).
By using other features of the Model 415,
tracking of the f-m receiver through the
complete f-m band
(88 MHz to 108 MHz) can
be performed. Harmonics of the 44 MHz i-f
sweep as well as harmonics of the 10. 7 MHz
sweep can be used to perform tracking
checks and adjustment on f-m receivers.
11.1.2.1 Connect the direct cable of the Model 415
to the
i-f alignment test point used in the
preceding section for 10.7 MHz i-f alignment.
11. l.2.2 Connect the r-f cable of the Model 415 to
the antenna terminals of the f-m receiver.
Place the impedance switch in the 300
position.
1 l.l.2.3 Place the FUNCTION switch of the Model
415 in the IF position. Set the sweep width
to maximum and turn on the 44 MHz mark-
er only. Center the marker on the oscillo-
scope trace.
11.1.2.4 Tune the f-m receiver to the lower end of
the f-m band, while waching the oscillo-
scope. The i-f response curve should be-
come visible on the oscilloscope pattern as
shown in Figure 11.3A. Use the ATTENU-
ATOR control as required to produce a
suitable pattern amplitude. Because of the
wide sweep width the response curve will
appear extremely narrow with full sweep
width. Reduce the sweep width at the same
time keeping the 44 MHz marker centered
on the oscilloscope. Adjust the tuning of
the f-m receiver to center the 44 MHz mark-
er on the i-f response curve of the receiver
as the sweep width is reduced. (Fig. 11.3B).
In this application a second harmonic of
the i-f sweep in the region of 44 MHz is
being used to generate sweep signal at
88
MHz. The 44 MHz marker can be inter-
preted as an
88 MHz crystal controlled
marker in this application.
B. Receiver Response Using Reduced Sweep Width
{44 MHz Marker Centered on Response Curve).
Figure 11.3 Checking F-M Receiver Tracking at the Low End of the F-M Band
79
I
 Loading...