4.2.5 CHANNEL 4
(Figures 4.14 and 4.15)
In this position the 44 MHz sweep is mixed
with the crystal-controlled output of the Chan-
nel 4 mixing oscillator at Mixer Amplifier
Q302. The output of this stage is fed through
the attenuator to the RF-IF-VIDEO OUT jack.
As explained in Par. 3.6, this generates an
r-f sweep for Channel 4. With the termination
switch of the 415 r-f cable in the 300 n posi-
tion, the signal is connected to the antenna
terminals of the receiver, so that the signal
is processed through the tuner and i-f stages.
The desired sweep range is selected as be-
fore by turning on the ADJ PIX (39.75) marker
and the ADJ SND (47.25) marker and center-
ing the sweep on the oscilloscope.
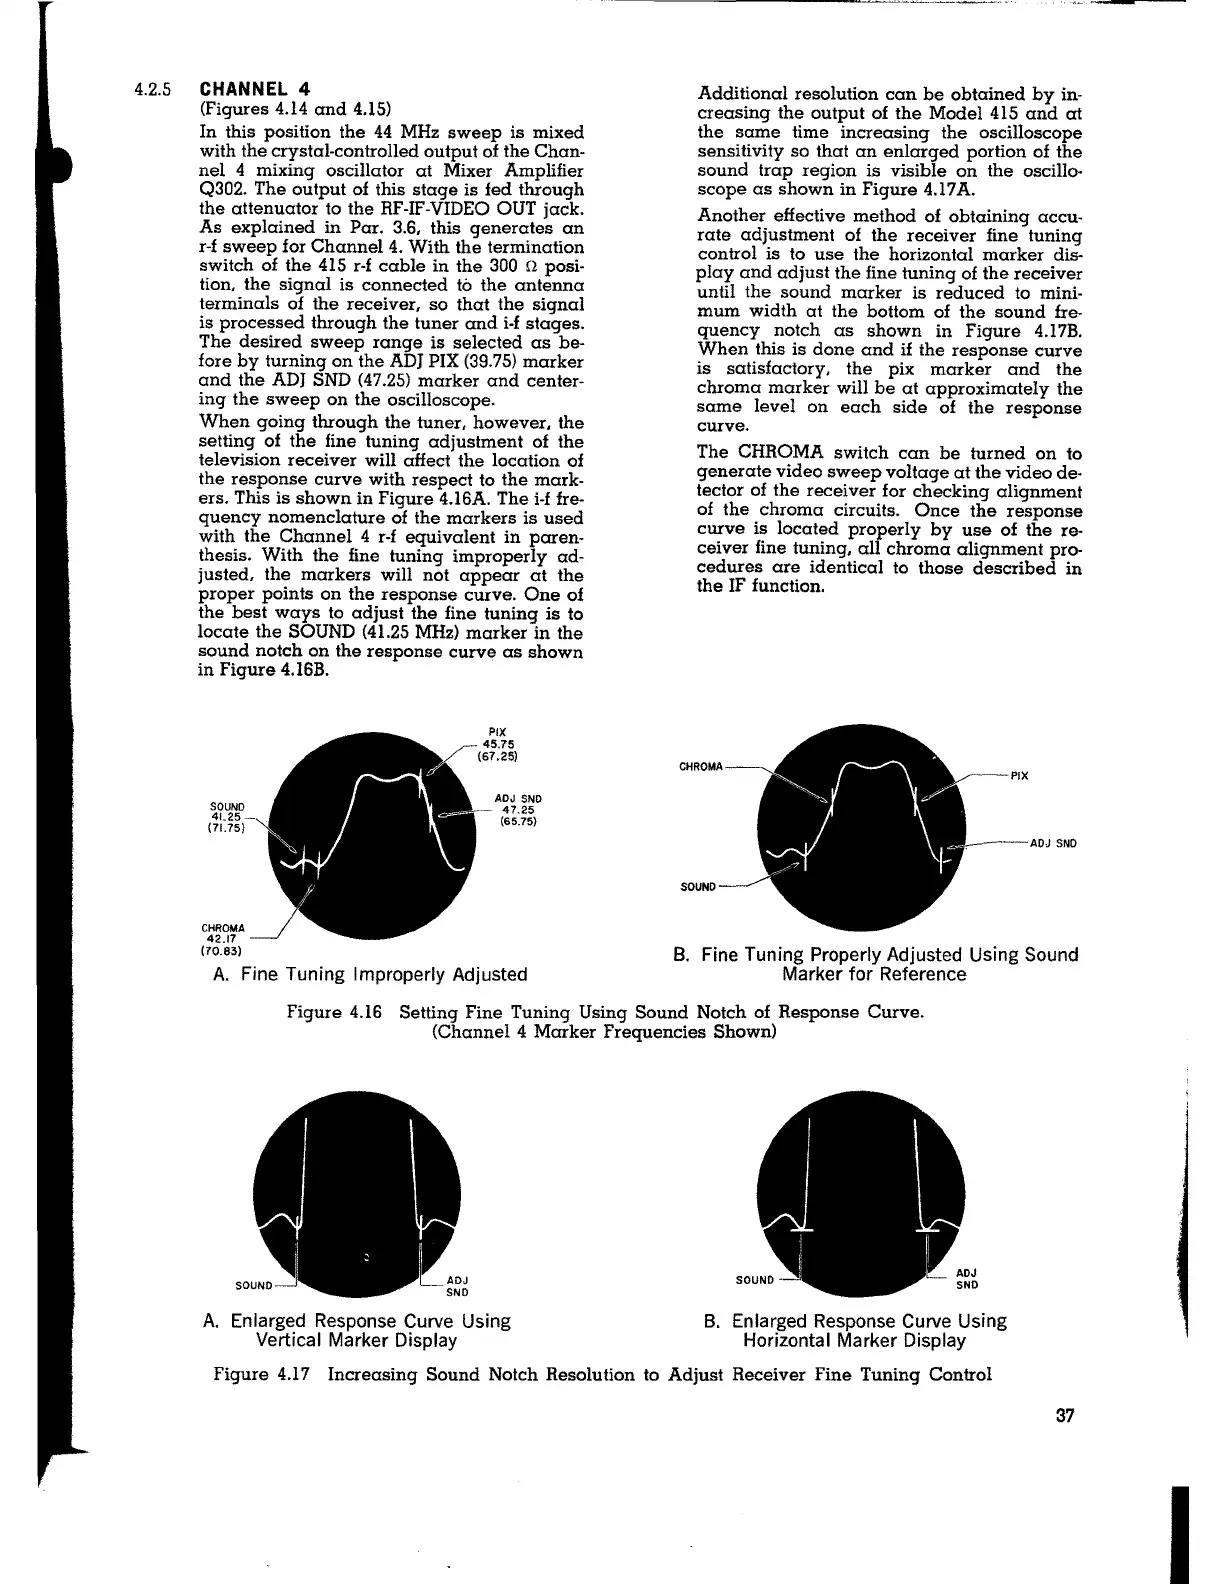
When going through the tuner, however, the
setting of the fine tuning adjustment of the
television receiver will affect the location of
the response curve with respect to the mark-
ers. This is shown in Figure 4.16A. The i-f fre-
quency nomenclature of the markers is used
with the Channel 4 r-f equivalent in paren-
thesis. With the fine tuning improperly ad-
justed, the markers will not appear at the
proper points on the response curve. One of
the best ways to adjust the fine tuning is to
locate the SOUND (41.25 MHz) marker in the
sound notch on the response curve as shown
in Figure 4.16B.
SOUND
41.25~
(71.75}
CHROMA
42.17
(70.83)
PIX
45.75
(67,25)
ADJ SND
47.25
(65.75}
A. Fine Tuning Improperly Adjusted
Additional resolution can be obtained by in-
creasing the output of the Model 415 and
at
the same time increasing the oscilloscope
sensitivity so that an enlarged portion of the
sound trap region is visible on the oscillo-
scope as shown in Figure 4.17 A.
Another effective method of obtaining accu-
rate adjustment of the receiver fine tuning
control is to use the horizontal marker dis-
play and adjust the fine tuning of the receiver
until the sound marker is reduced to mini-
mum width at the bottom of the sound fre-
quency notch as shown in Figure 4.17B.
When this is done and if the response curve
is satisfactory, the pix marker and the
chroma marker will be at approximately the
same level on each side of the response
curve.
The CHROMA switch can be turned on to
generate video sweep voltage at the video de-
tector of the receiver for checking alignment
of the chroma circuits. Once the response
curve is located properly by use of the re-
ceiver fine tuning, all chroma alignment pro-
cedures are identical to those described in
the IF function.
CHROMA
ADJ SNO
SOUND
8. Fine Tuning Properly Adjusted Using Sound
Marker for Reference
Figure 4.16 Setting Fine Tuning Using Sound Notch of Response Curve.
(Channel 4 Marker Frequencies Shown)
A. Enlarged Response Curve Using
Vertical Marker Display
B. Enlarged Response Curve Using
Horizontal Marker Display
Figure 4.17 Increasing Sound Notch Resolution to Adjust Receiver Fine Tuning Control
37
I