4.2.7
10.7 MHz
{Figures 4.20 and 4.21)
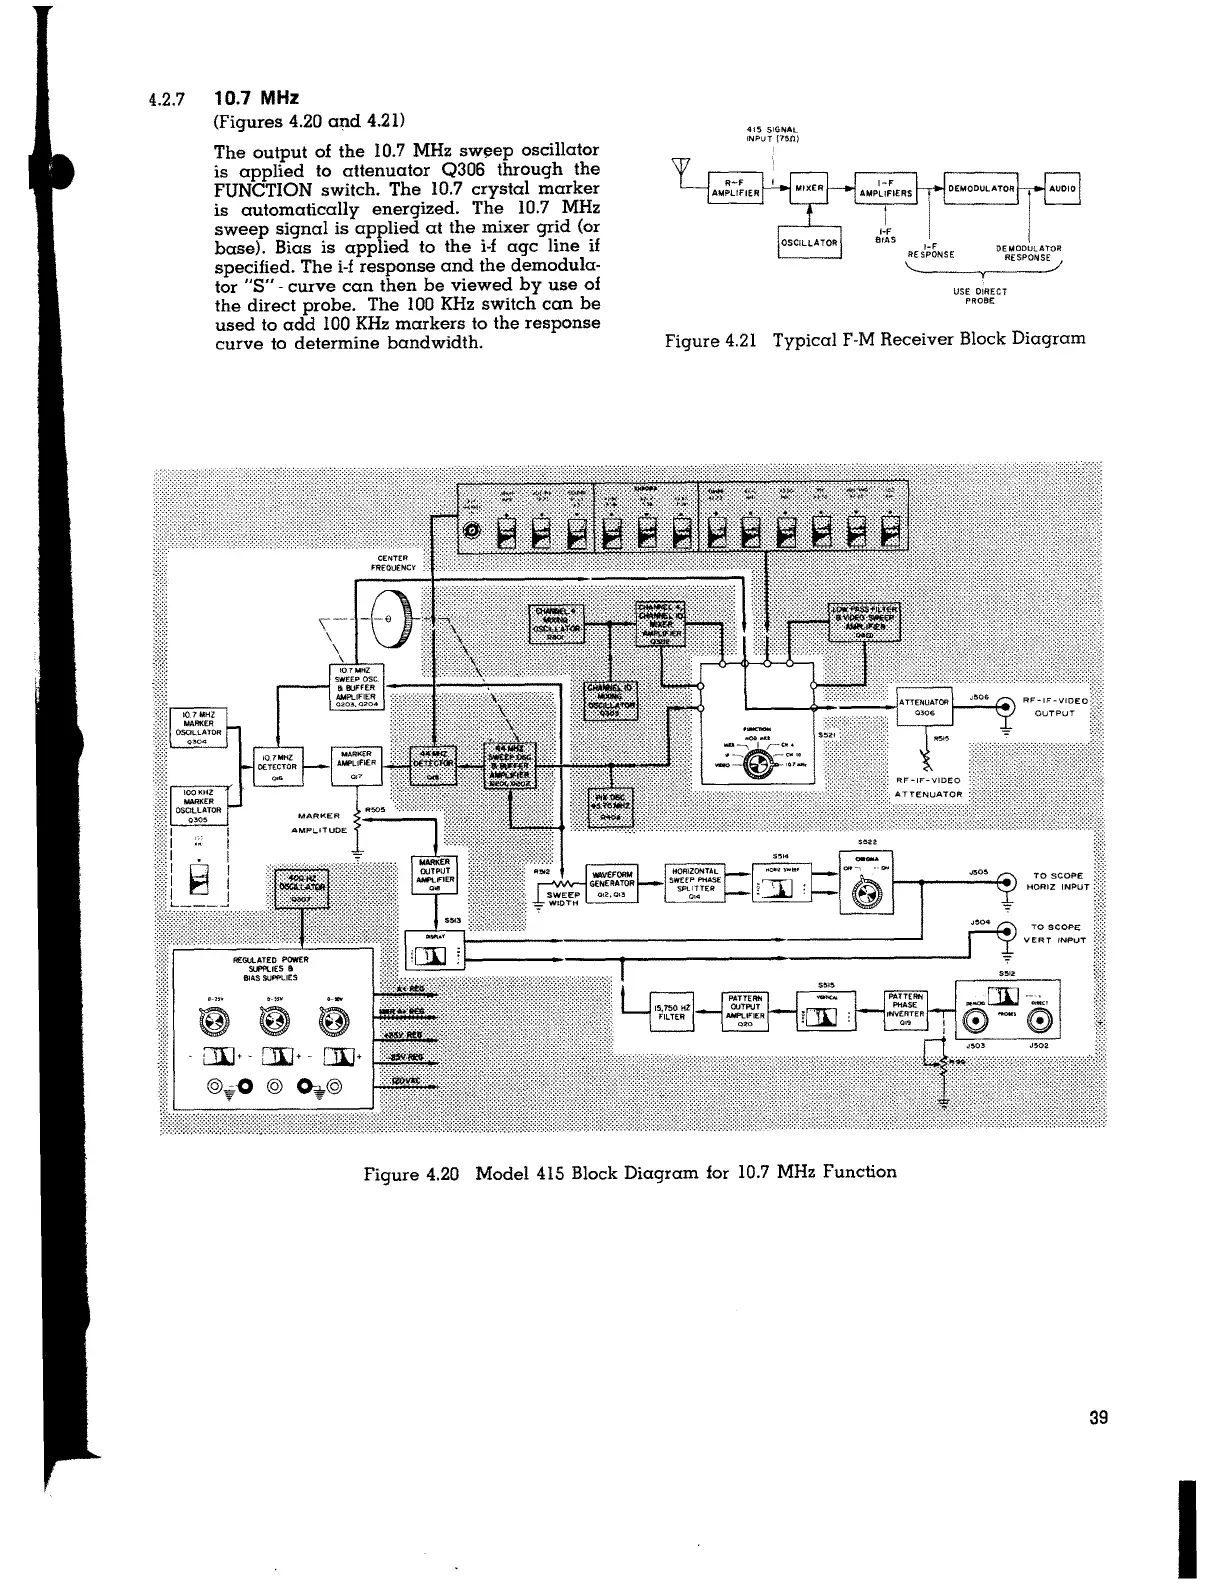
The output of the 10.7 MHz
sweep oscillator
is applied
to attenuator Q306 through the
FUNCTION switch. The 10.7 crystal marker
is automatically energized. The 10.7 MHz
sweep signal is applied at the mixer grid (or
base). Bias is applied to the i-f age line
if
specified. The i-f response and the demodula-
tor
"S" - curve can then be viewed by use of
the direct probe. The 100 KHz switch can be
used to add 100 KHz markers to the response
curve to determine bandwidth.
4!5 SIGNAL
INPUT {15n)
I
1-F
AMPLIFIERS
1-F
BIAS
DEMODULATOR )
REStp~NSE DER~~~~~~10R
USE O!RECT
PROBE
Figure 4.21 Typical F-M Receiver Block Diagram
TO SCOPE
HORIZ INPUT
TO SCOPE
VERT INPUT
Figure 4.20 Model 415 Block Diagram for 10.7 MHz Function
39
I