t
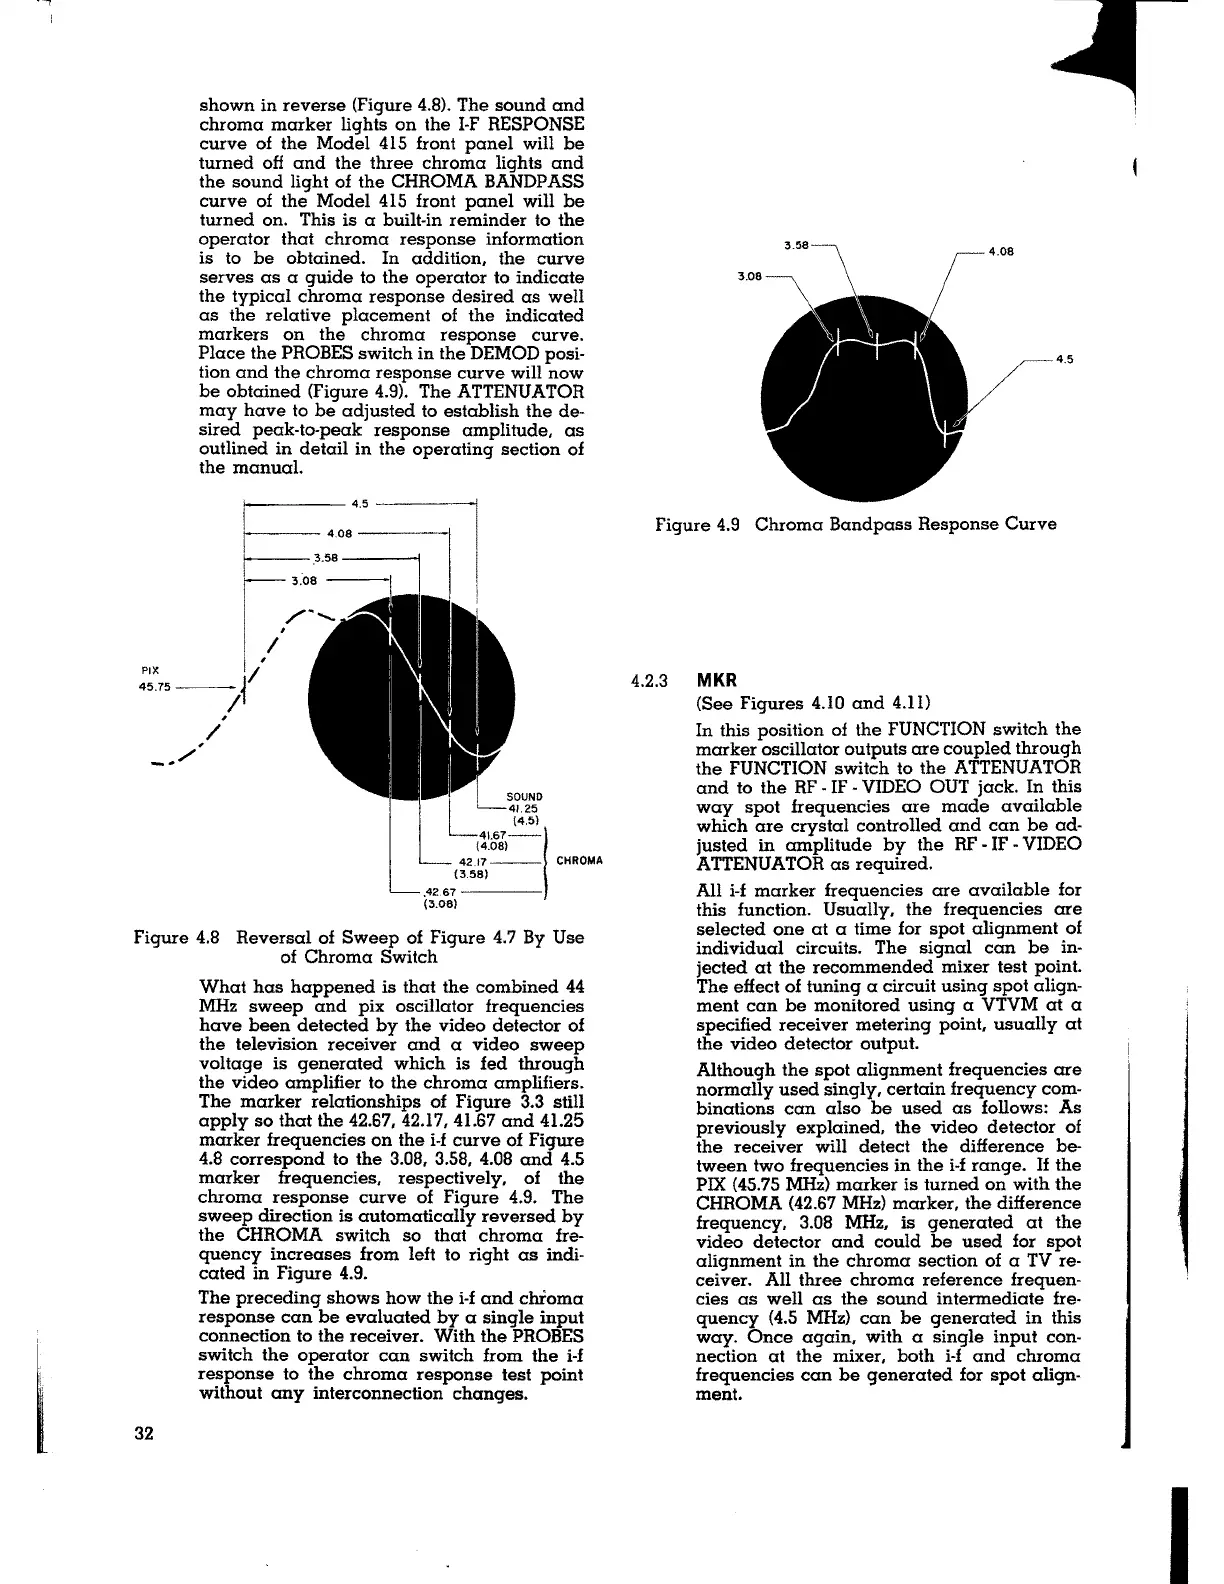
shown in reverse (Figure 4.8). The sound and
chroma marker lights on the I-F RESPONSE
curve of the Model 415 front panel will be
turned off and the three chroma lights and
the sound light of the CHROMA BANDPASS
curve of the Model 415 front panel will be
turned on. This is a built-in reminder to the
operator that chroma response information
is to be obtained. In addition, the curve
serves as a guide to the operator to indicate
the typical chroma response desired as well
as the relative placement of the indicated
markers on the chroma response curve.
Place the PROBES switch in the DEMOD posi-
tion and the chroma response curve will now
be obtained (Figure 4.9). The ATTENUATOR
may have to be adjusted to establish the
de-
sired peak-to-peak response amplitude, as
outlined in detail in the operating section of
the manual.
42.17 -- CHROMA
(3.58)
.4267----
(3.08)
Figure 4.8 Reversal of Sweep of Figure 4.7 By Use
32
of Chroma Switch
What has happened is that the combined 44
MHz sweep and pix oscillator frequencies
have been detected by the video detector of
the television receiver and a video sweep
voltage is generated which is fed through
the video amplifier to the chroma amplifiers.
The marker relationships of Figure 3.3 still
apply so that the 42.67, 42.17, 41.67 and 41.25
marker frequencies on the i-f curve of Figure
4.8 correspond to the 3.08, 3.58, 4.08 and 4.5
marker frequencies, respectively, of the
chroma response curve of Figure 4.9. The
sweep direction is automatically reversed by
the CHROMA switch so that chroma fre-
quency increases from left to right as indi-
cated in Figure 4.9.
The preceding shows how the i-f and chroma
response can be evaluated by a single input
connection to the receiver. With the PROBES
switch the operator can switch from the i-f
response to the chroma response test point
without any interconnection changes.
3.58
4.08
4.5
Figure 4.9 Chroma Bandpass Response Curve
4.2.3 MKR
(See Figures 4.10 and 4.11)
In this position of the FUNCTION switch the
marker oscillator outputs are coupled through
the FUNCTION switch to the ATTENUATOR
and to the RF -IF - VIDEO OUT jack. In this
way spot frequencies are made available
which are crystal controlled and can be ad-
justed in amplitude by the RF -IF -VIDEO
ATTENUATOR as required.
All i-f marker frequencies are available for
this function. Usually, the frequencies are
selected one at a time for spot alignment of
individual circuits. The signal can be in-
jected at the recommended mixer test point.
The effect of tuning a circuit using spot align-
ment can be monitored using a VTVM at a
specified receiver metering point, usually at
the video detector output.
Although the spot alignment frequencies are
normally used singly, certain frequency com-
binations can also be used as follows: As
previously explained, the video detector of
the receiver will detect the difference be-
tween two frequencies in the i-f range. If the
PIX (45.75 MHz) marker is turned on with the
CHROMA (42.67 MHz) marker, the difference
frequency, 3.08 MHz, is generated at the
video detector and could be used for spot
alignment in the chroma section of a TV re-
ceiver. All three chroma reference frequen-
cies as well as the sound intermediate fre-
quency (4.5 MHz) can be generated in this
way. Once again, with a single input con-
nection at the mixer, both i-f and chroma
frequencies can be generated for spot align-
ment.
I