4.2.2 IF POSITION (See Figures 4.4 and 4.5)
The 44 MHz sweep oscillator output is fed
through the FUNCTION switch to the attenu-
ator. Also, part of the sweep output is
coupled to the 44 MHz detector. The i-f
marker oscillators can be activated as de-
sired to generate markers. The markers ap-
pear as selected on the oscilloscope trace.
With the CHROMA switch in the OFF posi-
tion, notice that in selecting the sound and
chroma markers that the corresponding lights
on the i-f response curve of the Model 415
front panel are lighted to indicate that these
markers are energized.
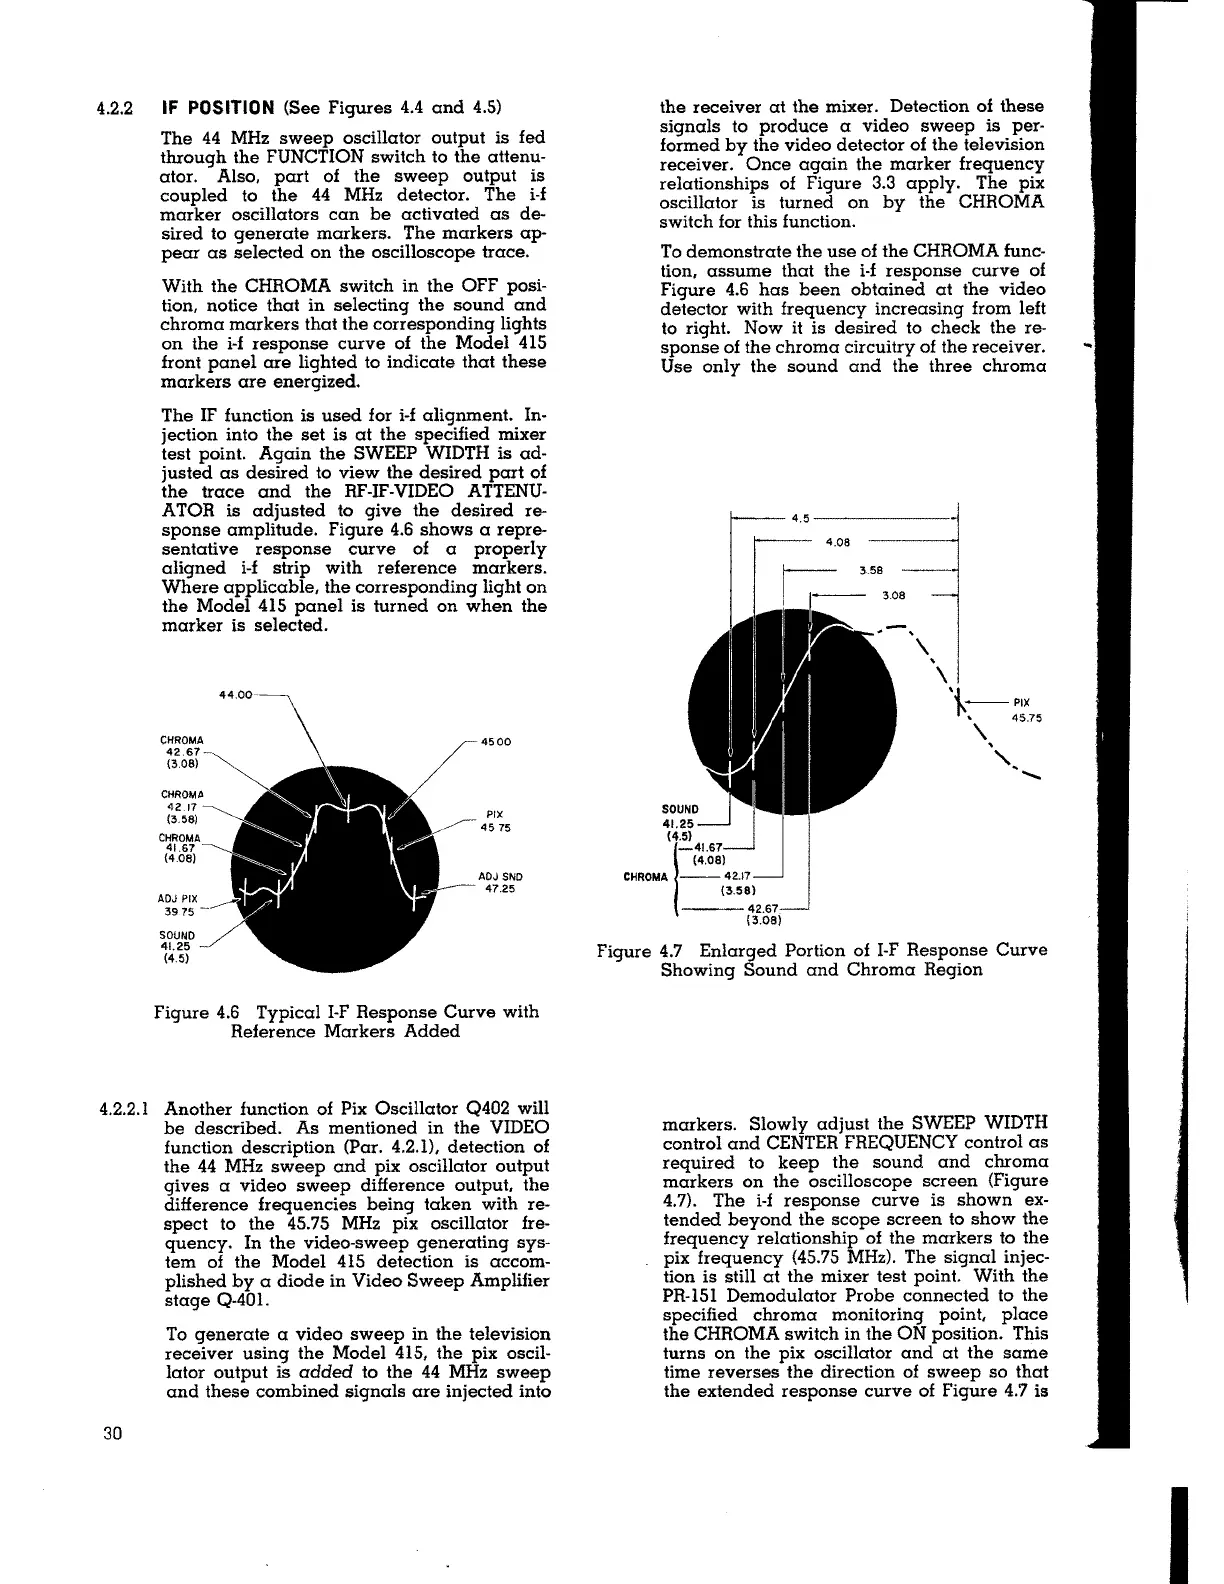
The IF function is used for i-f alignment. In-
jection into the set is at the specified mixer
test point. Again the SWEEP WIDTH is ad-
justed as desired to view the desired part of
the trace and the RF-IF-VIDEO ATTENU-
ATOR is adjusted to give the desired re-
sponse amplitude. Figure 4.6 shows a repre-
sentative response curve of a properly
aligned i-f strip with reference markers.
Where applicable, the corresponding light on
the Model 415 panel is turned on when the
marker is selected.
CHROMA
42.67-
(308)
CHROMb
42.17
(3.58)
CHROMA
41.67
(408)
SOUND
41.25
(4.5)
44.00-
4500
PIX
45 75
ADJ SND
47.25
Figure 4.6 Typical I-F Response Curve with
Reference Markers Added
4.2.2.1 Another function of Pix Oscillator Q402 will
be described. As mentioned in the VIDEO
function description (Par. 4.2.1), detection of
the 44 MHz sweep and pix oscillator output
gives a video sweep difference output, the
difference frequencies being taken with re-
spect to the 45.75 MHz pix oscillator fre-
quency. In the video-sweep generating sys-
tem of the Model 415 detection is accom-
plished by a diode in Video Sweep Amplifier
stage Q-401.
30
To generate a video sweep in the television
receiver using the Model 415, the pix oscil-
lator output is added to the 44 MHz sweep
and these combined signals are injected into
the receiver at the mixer. Detection of these
signals to produce a video sweep is per-
formed by the video detector of the television
receiver. Once again the marker frequency
relationships of Figure 3.3 apply. The pix
oscillator is turned on by the CHROMA
switch for this function.
To demonstrate the use of the CHROMA func-
tion, assume that the i-f response curve of
Figure 4.6 has been obtained at the video
detector with frequency increasing from left
to right. Now it is desired to check the re-
sponse of the chroma circuitry of the receiver.
Use only the sound and the three chroma
SOUND
41.25
(4.08)
<
4
1:::41.67
CHROMA -- 42.17
(3.58)
---42.67
(3.08)
4.5 --------'
4.08
r--- 3.58
1 ,---- 3.oa
'J
(\--PIX
' 45.75
'
Figure 4.7 Enlarged Portion of I-F Response Curve
Showing Sound and Chroma Region
markers. Slowly adjust the SWEEP
WIDTH
control and CENTER FREQUENCY control as
required to keep the sound and chroma
markers on the oscilloscope screen (Figure
4.7). The i-f response curve is shown ex-
tended beyond the scope screen to show the
frequency relationship of the markers to the
pix frequency (45.75 MHz). The signal injec-
tion is still at the mixer test point. With the
PR-151 Demodulator Probe connected to the
specified chroma monitoring point, place
the CHROMA switch in the ON position. This
turns on the pix oscillator and at the same
time reverses the direction of sweep so that
the extended response curve of Figure 4.7 is
I