2.2.2 TELEVISION RECEIVER TUNED CIRCUITS
In order to process the signals properly the
r-f section and
i-f section of the receiver must
possess certain gain and bandwidth charac-
teristics. These are determined by the num-
ber of amplifiers and
the associated tuned
circuits.
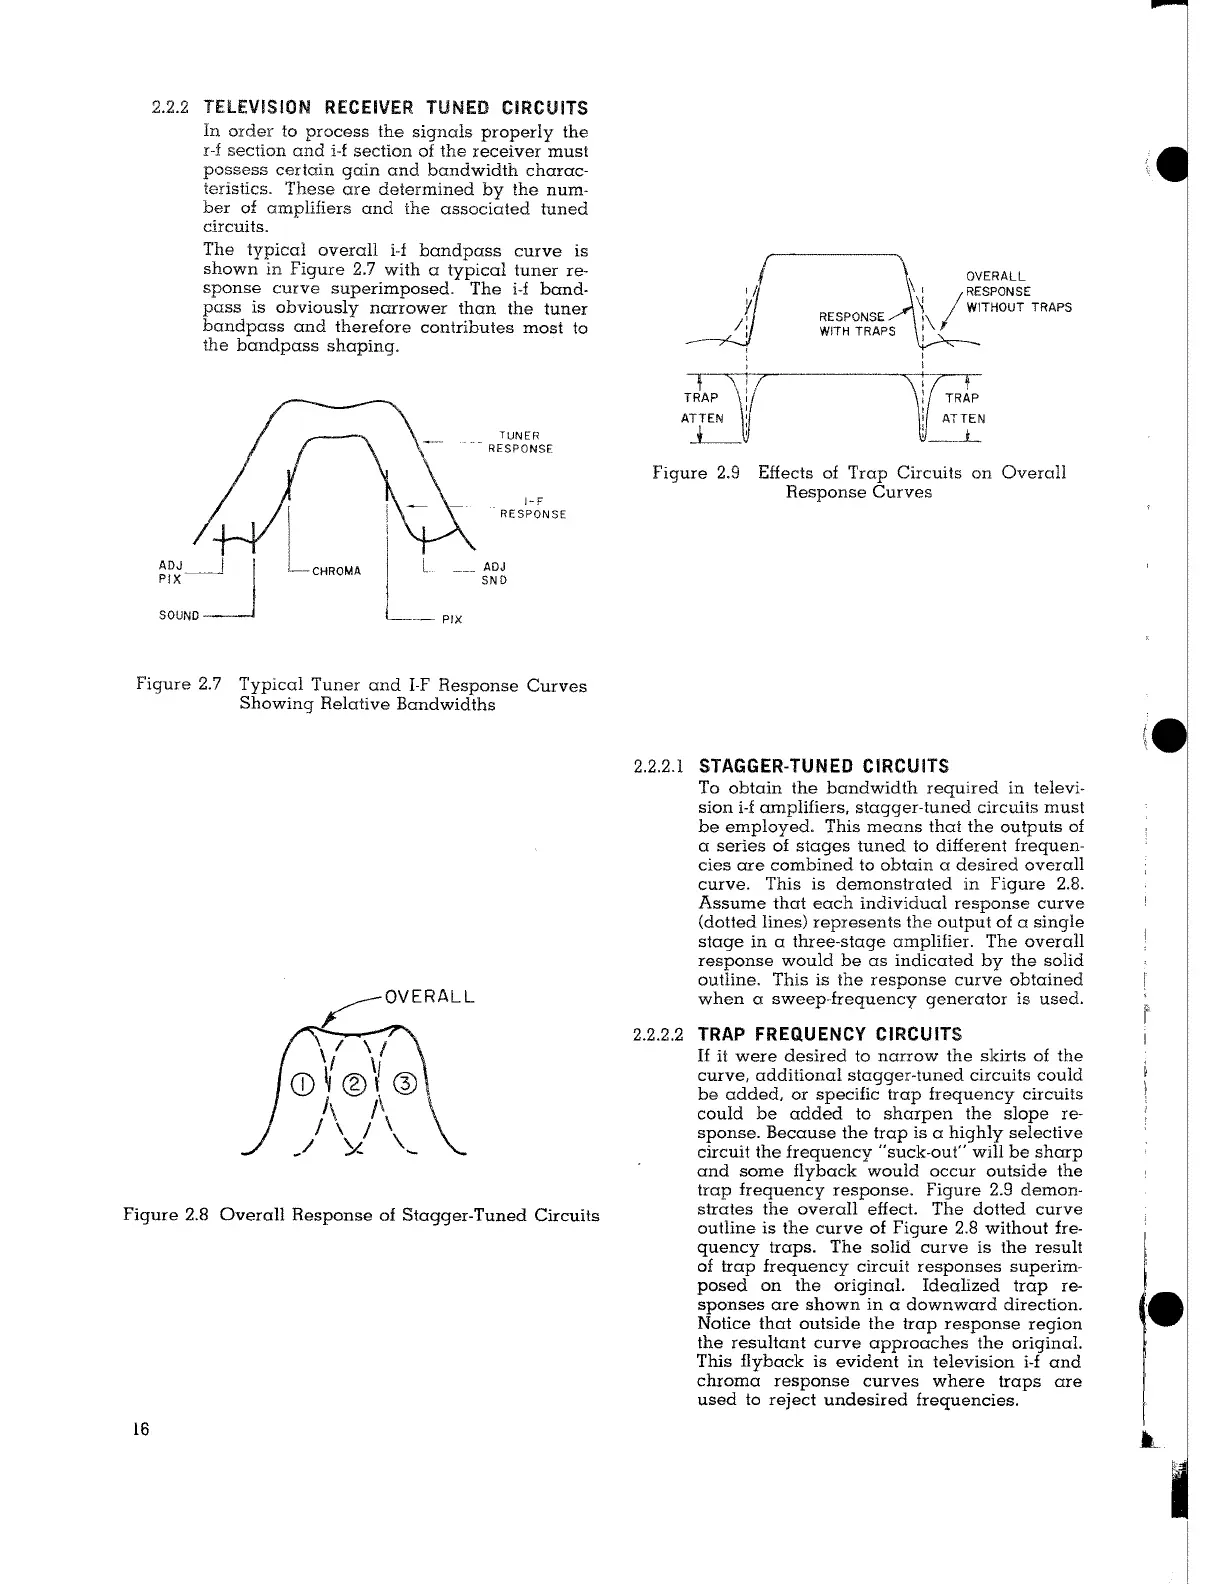
The typical overall i-f bandpass curve is
shown in Figure 2.7 with a typical tuner re-
sponse curve superimposed. The i-f band-
pass is obviously narrower than the tuner
bandpass and therefore contributes most to
the bandpass shaping.
TUNER
RESPONSE
1-F
RESPONSE
ADJ~
PIX--
SOUND
I
___ ADJ
SND
L--PJX
Figure 2.7 Typical Tuner and I-F Response Curves
Showing Relative Bandwidths
Figure 2.8 Overall Response of Stagger-Tuned Circuits
16
J
I
'
I
'
~I
TRAP
1
:;
ATTEN '
' '
....t____'
RESPONSE
WITH TRAPS
OVERALL
~
1 RESPONSE
~
I WITHOUT TRAPS
:\
I
Figure 2.9 Effects of Trap Circuits on Overall
Response Curves
2.2.2.1 STAGGER-TUNED CIRCUITS
To obtain the bandwidth required in televi-
sion i-f amplifiers, stagger-tuned circuits must
be employed. This means that the outputs of
a series of stages tuned to different frequen-
cies are combined to obtain a desired overall
curve. This is demonstrated in Figure 2.8.
Assume that each individual response curve
(dotted lines) represents the output of a single
stage in a three-stage amplifier. The overall
response would be as indicated by the solid
outline. This is the response curve obtained
when a sweep-frequency generator is used.
2.2.2.2
TRAP FREQUENCY CIRCUITS
If it were desired to narrow the skirts of the
curve, additional stagger-tuned circuits could
be added, or specific trap frequency
circuits
could be added to sharpen the slope re-
sponse. Because the trap is a highly selective
circuit the frequency "suck-out" will be sharp
and some flyback would occur outside the
trap frequency response. Figure 2.9 demon-
strates the overall effect. The dotted curve
outline is the curve of Figure 2.8 without fre-
quency traps. The solid curve is the result
of trap frequency circuit responses superim-
posed on the original. Idealized trap
re-
sponses are shown in a downward direction.
Notice that outside the trap response region
the resultant curve approaches the original.
This flyback is evident in television i-f and
chroma response curves where traps are
used to reject undesired frequencies.
f