3.7
26
VIDEO SWEEP AMPLIFIER Q401
When video sweep output is desired, the 45.75
MHz output of Pix Oscillator Q402 is added to
the output of the 44 MHz sweep oscillator and
the difference frequencies are detected at the
video amplifier stage Q40I. The detector per-
forms the same function as the video detector
in a television set. The difference between the
pix carrier and the sweep frequencies is
passed through a low-pass filter and the pix
carrier and i-f sweep frequencies are rejected.
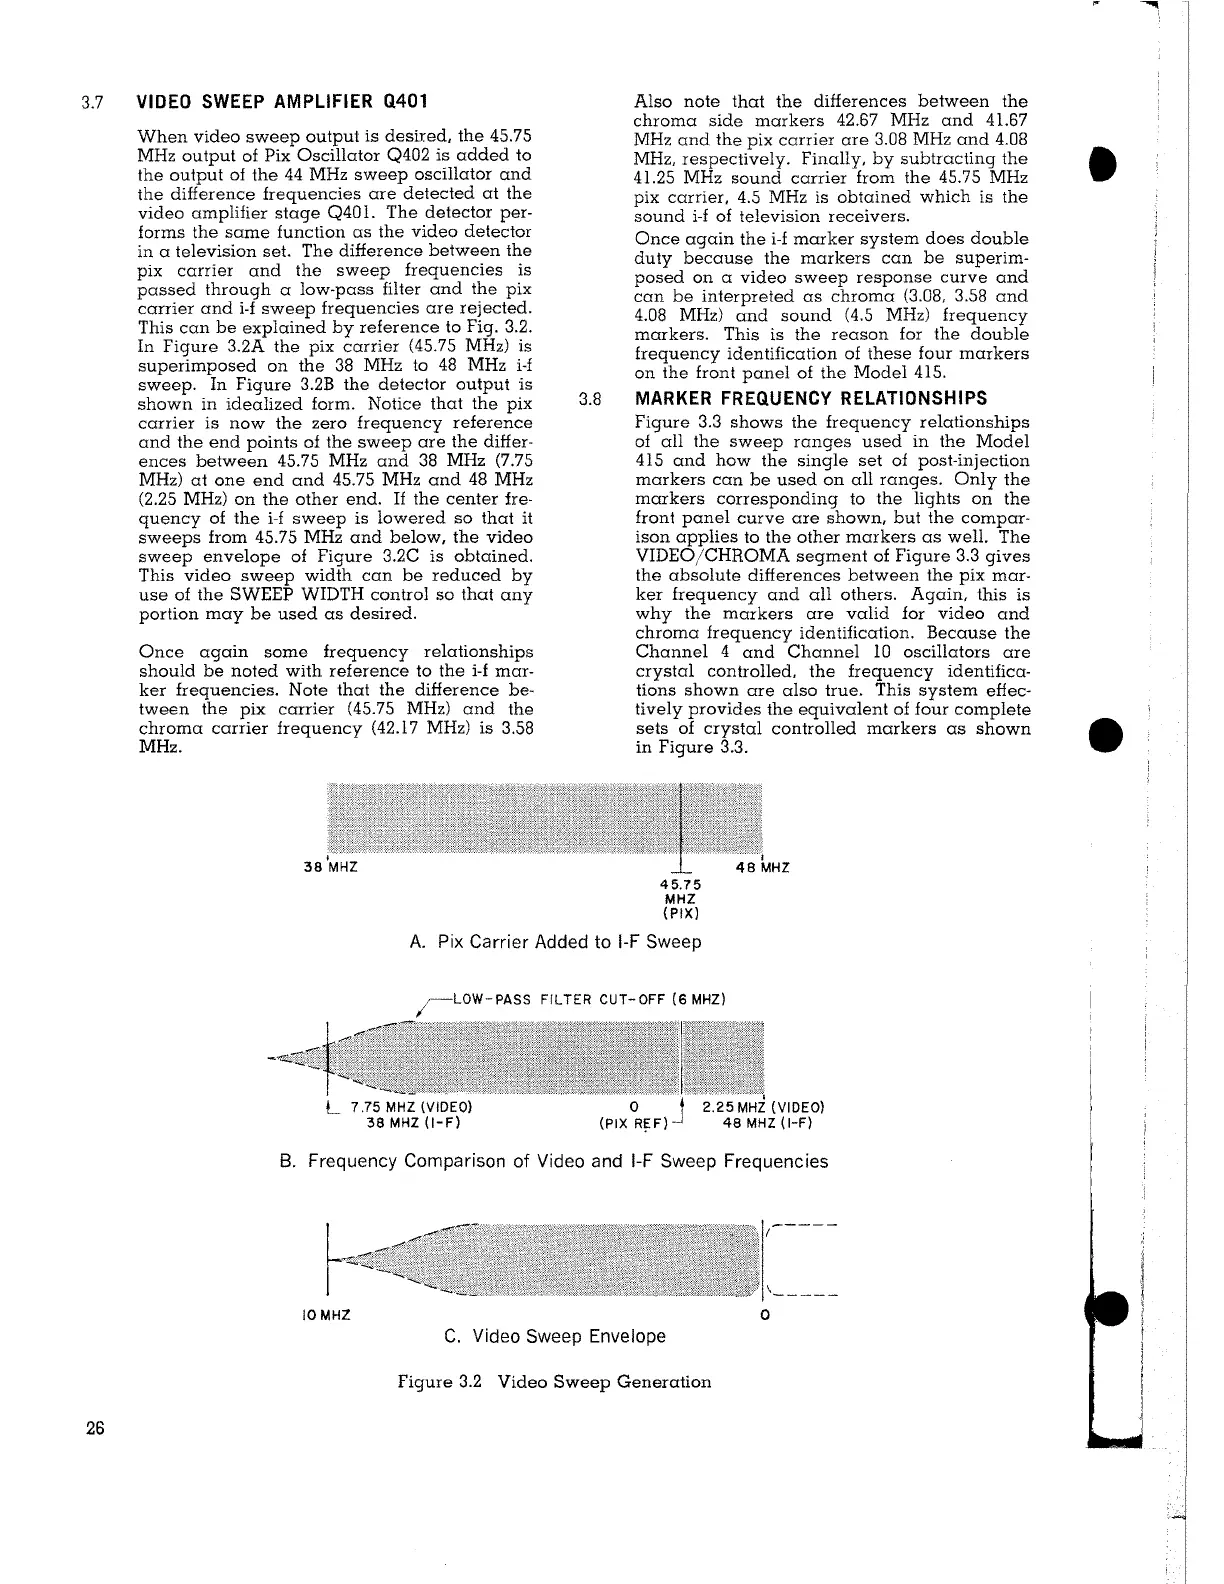
This can be explained by reference to Fig. 3.2.
In Figure 3.2A the pix carrier (45.75 MHz) is
superimposed on the 38 MHz to 48 MHz i-f
sweep. In Figure 3.2B the detector output is
shown in idealized form. Notice that the pix
carrier is now the zero frequency reference
and the end points of the sweep are the differ-
ences between 45.75 MHz and 38 MHz (7.75
MHz) at one end and 45.75 MHz and 48 MHz
(2.25 MHz) on the other end. If the center fre-
quency of the i-f sweep is lowered so that
it
sweeps from 45.75 MHz and below, the video
sweep envelope of Figure 3.2C is obtained.
This video sweep width can be reduced by
use of the SWEEP WIDTH control so that any
portion may be used as desired.
Once again some frequency relationships
should be noted with reference to the i-f mar-
ker frequencies. Note that the difference be-
tween the pix carrier (45.75 MHz) and the
chroma carrier frequency (42.17 MHz) is 3.58
MHz.
3.8
Also note that the differences between the
chroma side markers 42.67 MHz and 41.67
MHz and the pix carrier are 3.08 MHz and 4.08
MHz, respectively. Finally, by subtracting the
41.25 MHz sound carrier from the 45.75 MHz
pix carrier, 4.5 MHz is obtained which is the
sound i-f of television receivers.
Once again the i-f marker system does double
duty because the markers can be superim-
posed on a video sweep response curve and
can be interpreted as chroma (3.08, 3.58 and
4.08 MHz) and sound (4.5 MHz) frequency
markers. This is the reason for the double
frequency identification of these four markers
on the front panel of the Model 415.
MARKER FREQUENCY RELATIONSHIPS
Figure 3.3 shows the frequency relationships
of all the sweep ranges used in the Model
415 and how the single set of post-injection
markers can be used on all ranges. Only the
markers corresponding to the lights on the
front panel curve are shown, but the compar-
ison applies to the other markers as well. The
VIDEO/CHROMA segment of Figure 3.3 gives
the absolute differences between the pix mar-
ker frequency and all others. Again, this is
why the markers are valid for video and
chroma frequency identification. Because the
Channel 4 and Channel IO oscillators are
crystal controlled, the frequency identifica-
tions shown are also true. This system effec-
tively provides the equivalent of four complete
sets of crystal controlled markers as shown
in Figure 3.3.
45.75
MHZ
{PIX)
A. Pix Carrier Added to 1-F Sweep
/-LOW-PASS FILTER CUT-OFF (6 MHZ)
L 7 .75 MHZ (VIDEO)
38 MHZ (1-F)
0 j 2.25 MHZ (VIDEO)
(PIX
R~ F) 48 MHZ ( 1-F)
8. Frequency Comparison of Video and 1-F Sweep Frequencies
IOMHZ 0
C. Video Sweep Envelope
Figure 3.2 Video Sweep Generation
I
e