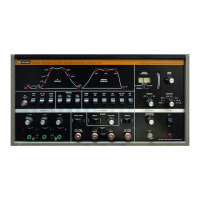
INTRODUCTION TO TELEVISION RECEIVER ALIGNMENT USING THE MODEL 415
4.0 MATctflNG THE MODEL 415 TO THE
RECEIVER
Using the simplified receiver block diagram
of Figure 2.6 and the Model 415 block dia-
gram of Figure
3.1. we will proceed through
the positions of the Model 415 FUNCTION
switch.
In each position we will show the stages of
the Model 415 which are involved in gen-
erating the desired signals and also show
the related signal injection points and mon-
itoring points of the television receiver.
4.1 GENERAL ALIGNMENT INFORMATION
The following paragraphs give general align-
ment information as an introduction to the
operating descriptions of the 415 as used in
television receiver alignment.
4.1.1 VIDEO SWEEP ALIGNMENT OF CHROMA
CIRCUITS
In some sets, a prealignment of the chroma
circuits of the receiver using video sweep is
specified. In this application the video
sweep output of the 415 is connected to the
set as specified by the manufacturer, the in-
jection point usually being the input of the
bandpass amplifiers. The circuit response is
monitored using the demodulator probe.
4.1.2 1-F AND CHROMA ALIGNMENT CHECKS
If
it is desired to check i-f and chroma re-
sponse by injecting the sweep signal at the
mixer grid, the i-f sweep output of the 415 is
applied to the mixer test point which is
usually the grid (tube-type) or base (transis-
torized) of the mixer. The connection loca-
tions of the direct and demodulator cables
are the same as for the overall alignment.
The r-f age bias is raised for this procedure
to cut off the r-f amplifier stage of the tuner.
This eliminates possible interference from
str0I1g local stations.
4.1.3
PREALIGNMENT OF TRAPS AND TUNED
CIRCUITS USING MARKER FREQUENCIES
The Model 415 output is connected to the
mixer test point of the receiver. When using
modulated markers, the effects of tuning the
coils is observed by connecting the direct
cable of the Model 415 to the video detector
test point and tuning for either minimum re-
covered 400 Hz or maximum recovered 400 Hz
3.58
depending on whether traps or bandpass
coils, respectively, are being aligned.
4.1.4 OVERALL RECEIVER ALIGNMENT CHECK
To check overall receiver alignment (tuner
and i-f) the Channel 4 or Channel 10 output
of the Model 415 is connected to the an-
tenna terminals of the receiver. The direct
accessory cable of the 415 is connected at the
video detector output and the PR-151 Demod-
ulator Probe is connected at the bandpass
amplifier output.
The locations of the monitoring points are
specified by the manufacturer and should be
observed in response checks or alignment
procedures. Apply bias to the r-f and i-f age
lines as specified by the manufacturer. This
"clamps" or locks the age line at a constant
voltage to maintain constant r-f and i-f gain
during sweep alignment.
Separate bias voltages are usually specified.
In addition,
if chroma alignment is to be
checked or performed, an additional bias is
required for this section. The three internal
bias supplies of the Model 415 are more
than adequate for these requirements.
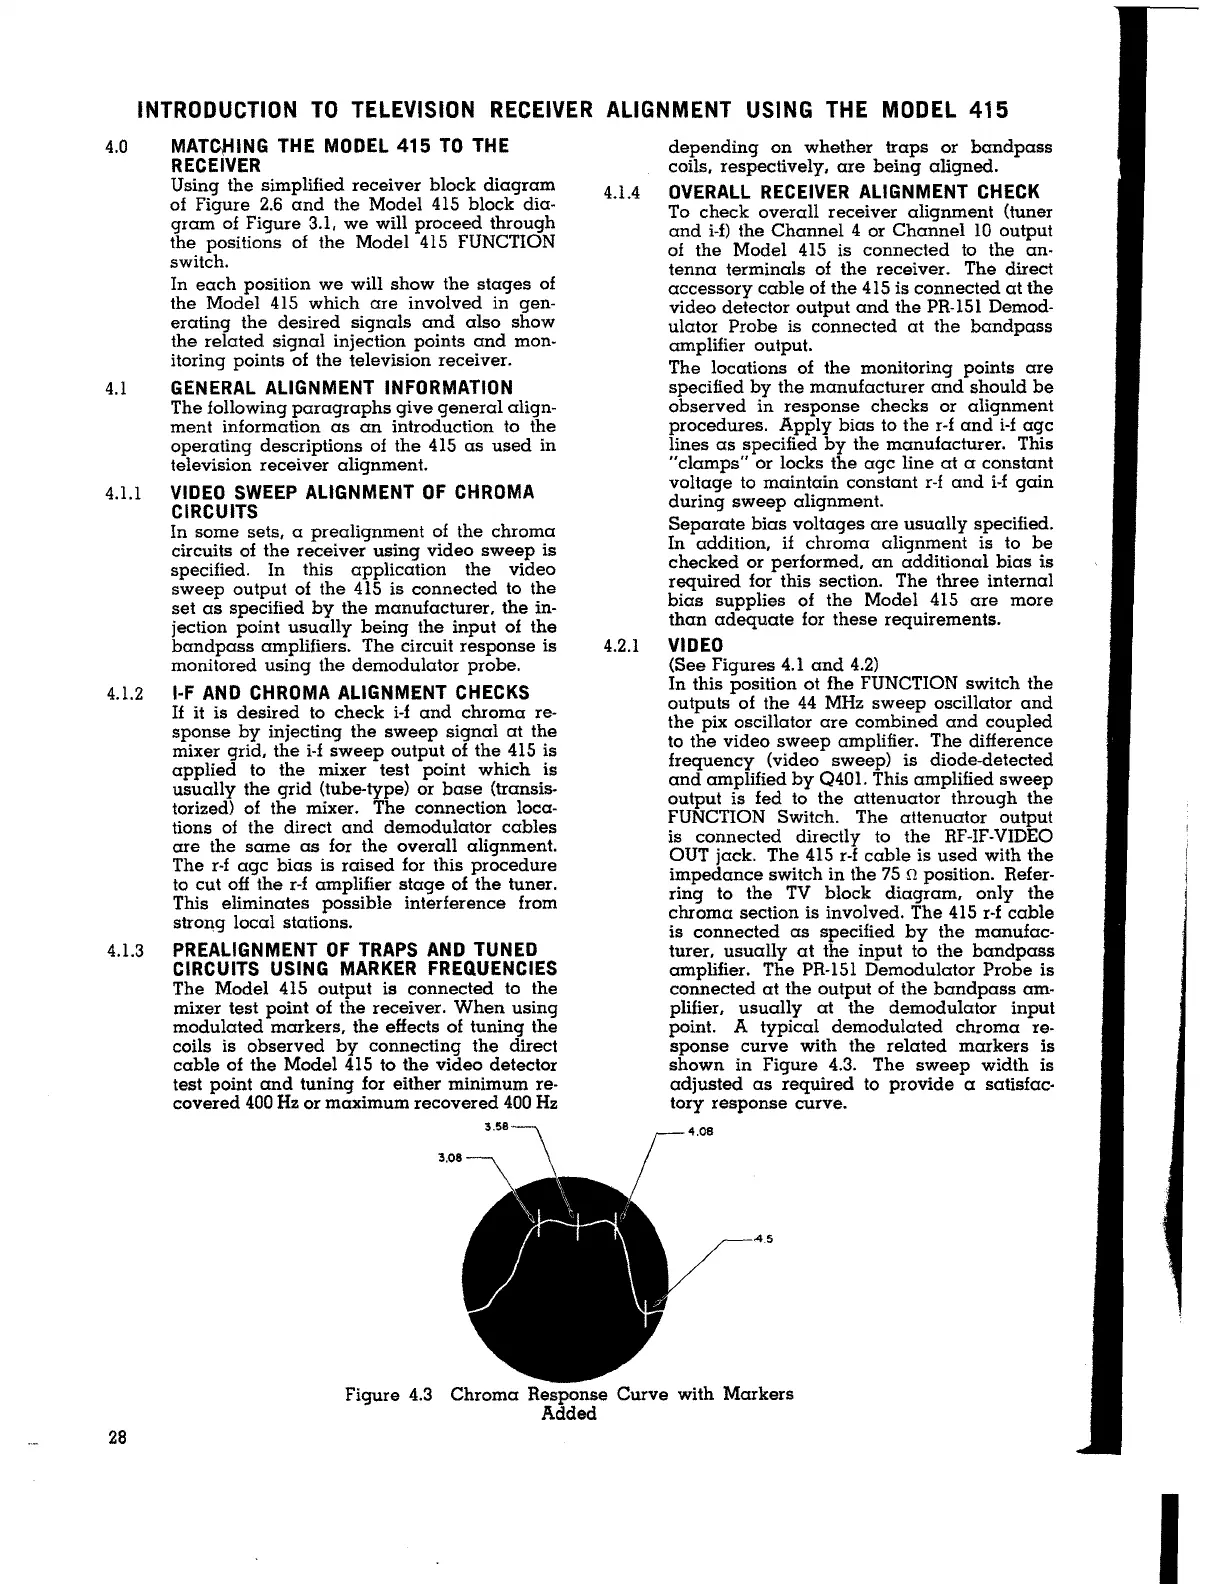
4.2.1
VIDEO
(See Figures 4.1 and 4.2)
In this position ot fhe FUNCTION switch the
outputs of the 44 MHz sweep oscillator and
the pix oscillator are combined and coupled
to the video sweep amplifier. The difference
frequency (video sweep) is diode-detected
and amplified by Q401. This amplified sweep
output is fed to the attenuator through the
FUNCTION Switch. The attenuator output
is connected directly to the RF-IF-VIDEO
OUT jack. The 415 r-f cable is used with the
impedance switch in the 75 n position. Refer-
ring to the TV block diagram, only the
chroma section is involved. The 415 r-f cable
is connected as specified by the manufac-
turer, usually at the input to the bandpass
amplifier. The PR-151 Demodulator Probe is
connected at the output of the bandpass
am-
plifier, usually at the demodulator input
point. A typical demodulated chroma re-
sponse curve with the related markers is
shown in Figure 4.3. The sweep width is
adjusted as required to provide a satisfac-
tory response curve.
4.5
Figure 4.3 Chroma Response Curve with Markers
Added
28
I