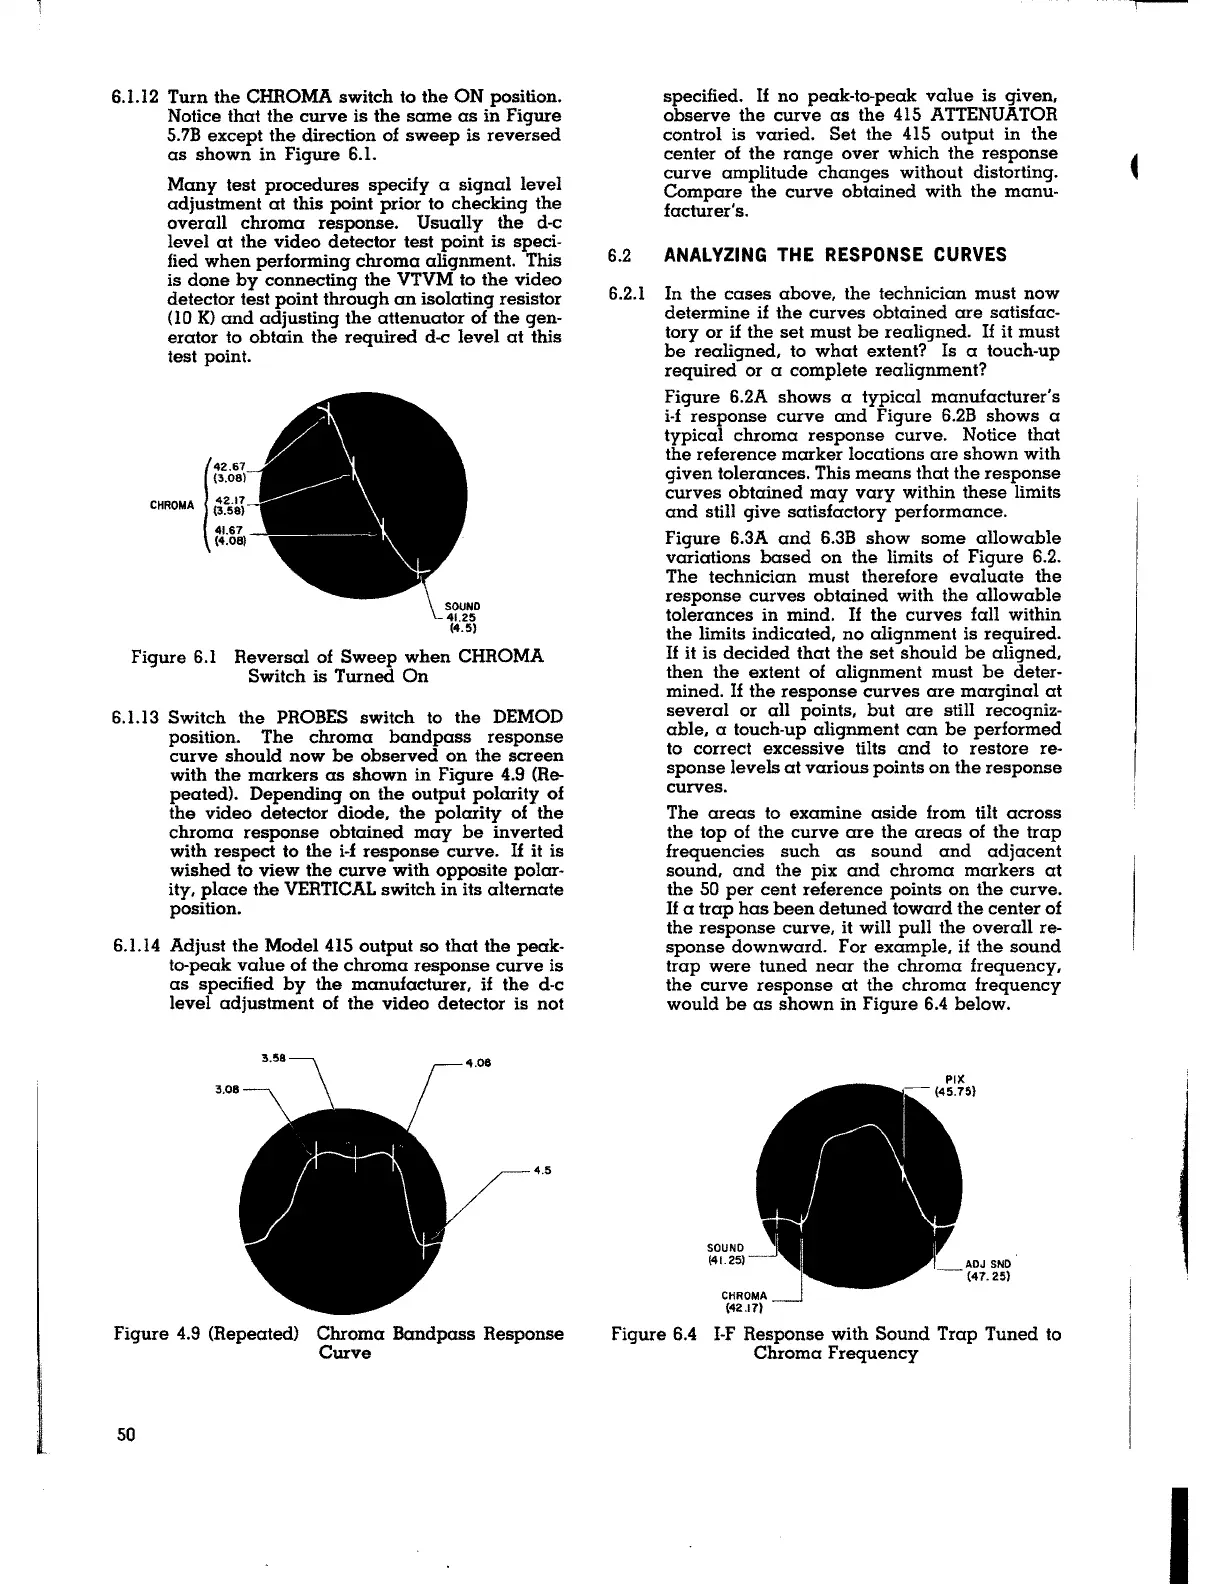
6.1.12 Turn the CHROMA switch to the ON position.
Notice that the curve is the same as in Figure
5.7B except the direction of sweep is reversed
as shown in Figure 6.1.
Many test procedures specify a signal level
adjustment at this point prior to checking the
overall chroma response. Usually the d-c
level at the video detector test point is speci-
fied when performing chroma alignment. This
is done by connecting the VTVM to the video
detector test point through an isolating resistor
(10 K) and adjusting the attenuator of the gen-
erator to obtain the required d-c level at this
test point.
(
42.67
(3.08)
CHROMA
42
.1
7
(3.58)
41.67
(4.08)
Figure 6.1 Reversal of Sweep when CHROMA
Switch is Turned On
6.l.13 Switch the PROBES switch to the DEMOD
position. The chroma bandpass response
curve should now be observed on the screen
with the markers as shown in Figure 4.9 (Re-
peated). Depending on the output polarity of
the video detector diode, the polarity of the
chroma response obtained may be inverted
with respect to the i-f response curve.
If it is
wished to view the curve with opposite polar-
ity, place the VERTICAL switch in its alternate
position.
6.1.14 Adjust the Model 415 output so that the peak-
to-peak value of the chroma response curve is
as specified by the manufacturer, if the d-c
level adjustment of the video detector is not
3.58
4.08
4.5
Figure 4.9 (Repeated) Chroma Bandpass Response
Curve
50
specified. If no peak-to-peak value is given,
observe the curve as the 415 ATTENUATOR
control is varied. Set the 415 output in the
center of the range over which the response
curve amplitude changes without distorting.
Compare the curve obtained with the manu-
facturer's.
6.2
ANALYZING THE RESPONSE CURVES
6.2.l In the cases above, the technician must now
determine if the curves obtained are satisfac-
tory or if the set must be realigned. If it must
be realigned, to what extent? Is a touch-up
required or a complete realignment?
Figure 6.2A shows a typical manufacturer's
i-f response curve and Figure 6.2B shows a
typical chroma response curve. Notice that
the reference marker locations are shown with
given tolerances. This means that the response
curves obtained may vary within these limits
and still give satisfactory performance.
Figure 6.3A and 6.3B show some allowable
variations based on the limits of Figure
6.2.
The technician must therefore evaluate the
response curves obtained with the allowable
tolerances in mind.
If the curves fall within
the limits indicated, no alignment is required.
If it is decided that the set should be aligned,
then the extent of alignment must be deter-
mined. If the response curves are marginal at
several or all points, but are still recogniz-
able, a touch-up alignment can be performed
to correct excessive tilts and to restore re-
sponse levels at various points on the response
curves.
The areas to examine aside from tilt across
the top of the curve are the areas of the trap
frequencies such as sound and adjacent
sound, and the pix and chroma markers at
the 50 per cent reference points on the curve.
If a trap has been detuned toward the center of
the response curve, it will pull the overall
re-
sponse downward. For example, if the sound
trap were tuned near the chroma frequency,
the curve response at the chroma frequency
would be as shown in Figure 6.4 below.
SOUND
(41.25)
ADJ SND
(47.25)
Figure 6.4 I-F Response with Sound Trap Tuned to
Chroma Frequency
I