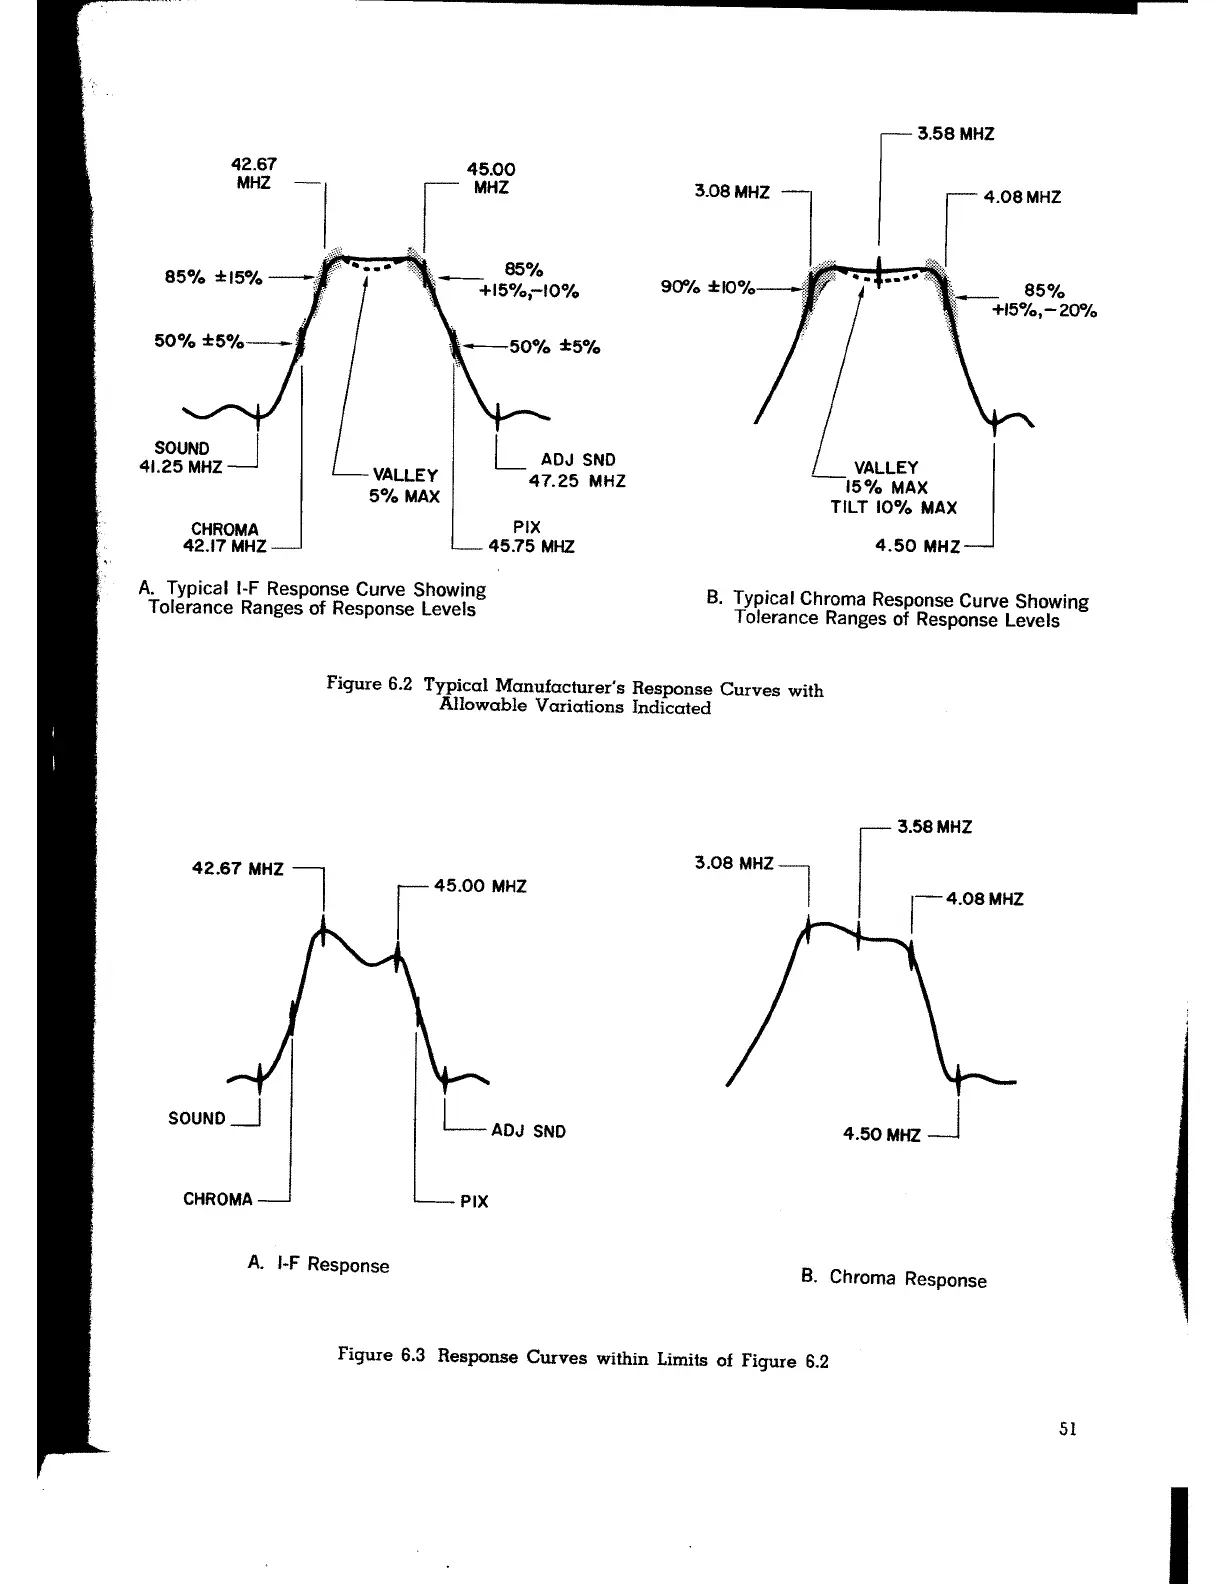
42.67
MHZ
50%±5%-
SOUND _J
41.25 MHZ
CHROMA
42.17 MHZ
45.00
J~ MHZ
,ifiA!P!!-....,~L S5%
. ··-+15%,-10%
VALLEY
5%MAX
L ADJ SND
47.25 MHZ
PIX
45.75 MHZ
A. Typical 1-F Response Curve Showing
Tolerance Ranges of Response Levels
3.08MHZ -
····- 85%
+15%,-20%
VALLEY
J
--15% MAX
TILT 10% MAX
4.50 MHZ
B. Typical Chroma Response Curve Showing
Tolerance Ranges of Response Levels
Figure 6.2 Typical Manufacturer's Response Curves with
Allowable Variations Indicated
42.67 MHZ l
145.00 MHZ
3.08MHZ
1
1
3.58MHz
j 1-4.0SMHZ
SOUNO_j
LADJ SND
4.50MHZ_J
CHROMA
PIX
A. 1-F Response
B. Chroma Response
Figure 6.3 Response Curves within Limits of Figure 6.2
51
I