9.2.2 ALIGNMENT OF AFT CIRCUITS
9.2.2.l The interconnection diagram of Figure 5.2
and the set-up instructions of Paragraph 5.2
apply in the following. Actually, the auto-
matic fine tuning alignment can be performed
upon completion of the i-f alignment proce-
dure with no changes in set-up connections
other than connecting the direct cable of the
Model 415 to the AFT test point and placing
the PROBES switch in the DIRECT position.
9.2.2.2
9.2.2.3
66
INCREASING
~
FREQUENCY
A. "$"-Curve Presentation
Using Wide 1-F Sweep
B. "S"-Curve at Reduced
1-F Sweep
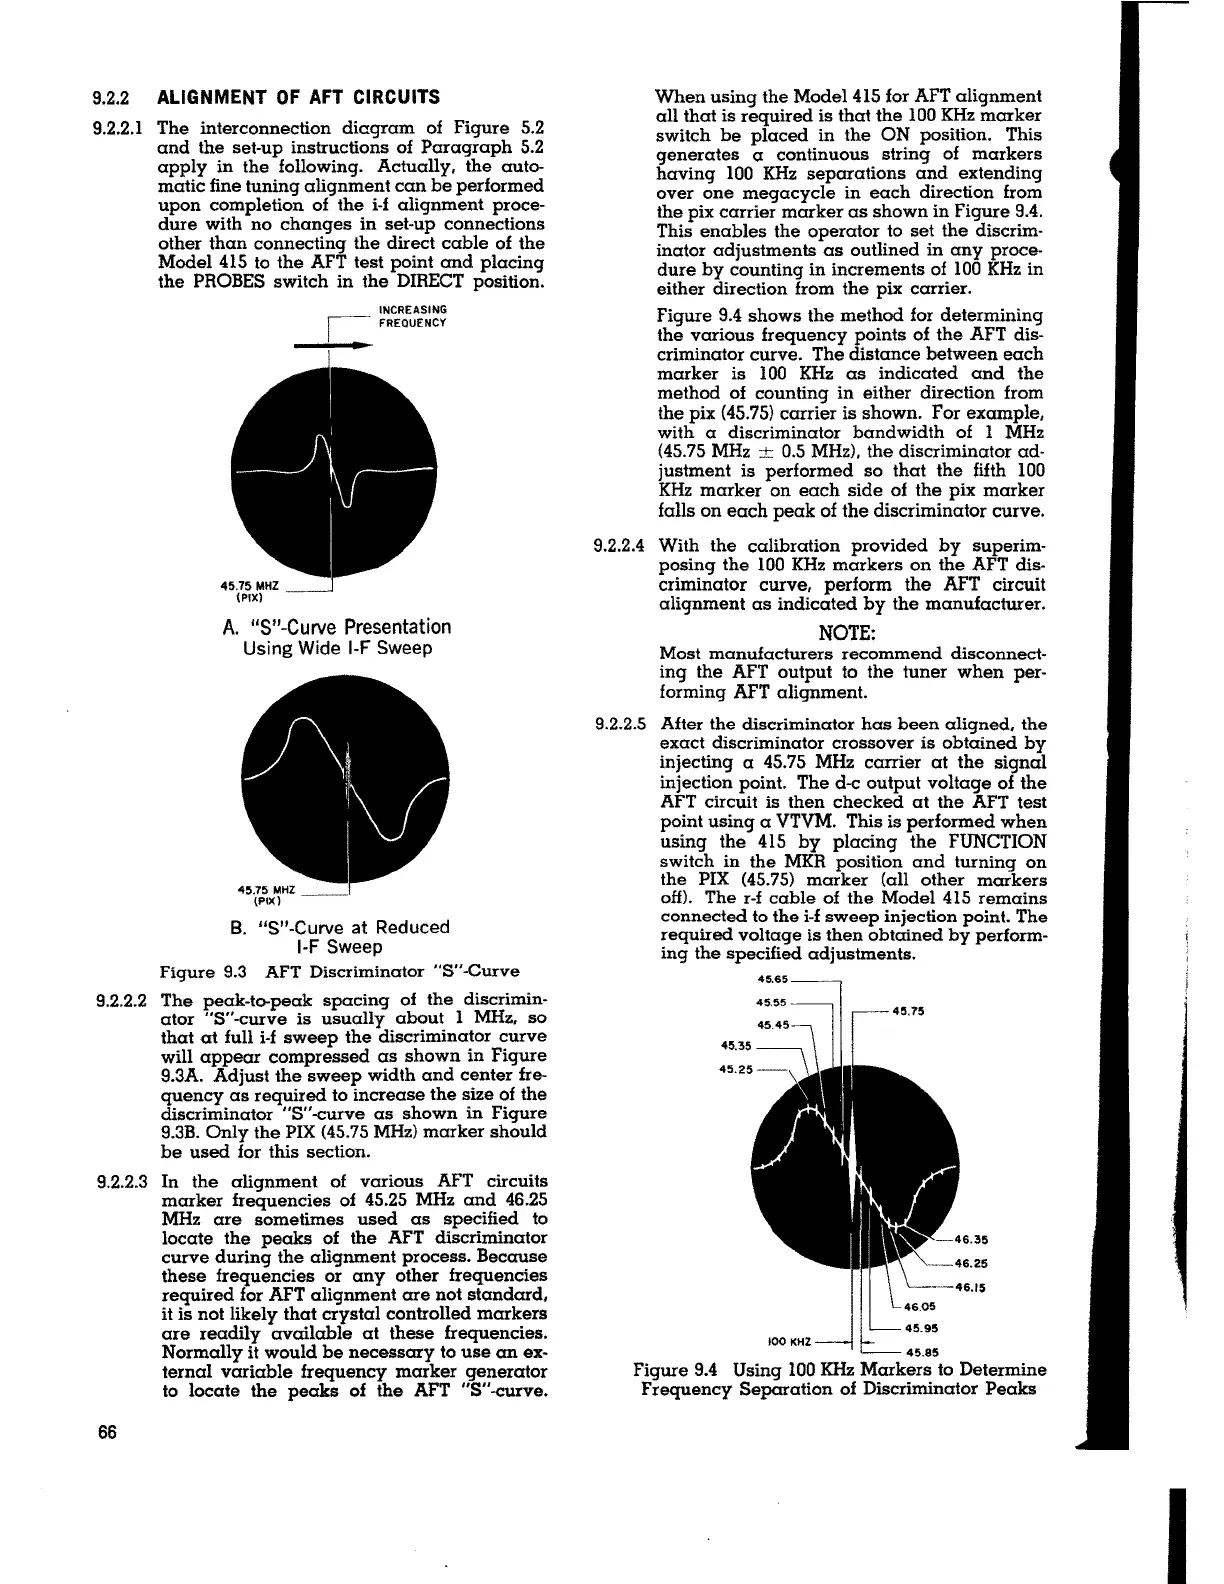
Figure 9.3 AFT Discriminator "S" -Curve
The peak-to-peak spacing of the discrimin-
ator "S"-curve is usually about I MHz, so
that at full i-f sweep the discriminator curve
will appear compressed as shown in Figure
9.3A. Adjust the sweep width and center fre-
quency as required to increase the size of the
discriminator "$"-curve as shown in Figure
9.3B. Only the PIX (45.75 MHz) marker should
be used for this section.
In the alignment of various AFT circuits
marker frequencies of 45.25 MHz and 46.25
MHz are sometimes used as specified to
locate the peaks of the AFT discriminator
curve during the alignment process. Because
these frequencies or any other frequencies
required for AFT alignment are not standard,
it is not likely that crystal controlled markers
are readily available at these frequencies.
Normally
it would be necessary to use an ex-
ternal variable frequency marker generator
to locate the peaks of the AFT "$"-curve.
When using the Model 415 for AFT alignment
all that is required is that the 100 KHz marker
switch be placed in the ON position. This
generates a continuous string of markers
having 100 KHz separations and extending
over one megacycle in each direction from
the pix carrier marker as shown in Figure 9.4.
This enables the operator to set the discrim-
inator adjustments as outlined in any proce-
dure by counting in increments of 100 KHz in
either direction from the pix carrier.
Figure 9.4 shows the method for determining
the various frequency points of the AFT dis-
criminator curve. The distance between each
marker is 100 KHz as indicated and the
method of counting in either direction from
the pix (45.75) carrier is shown. For example,
with a discriminator bandwidth of 1 MHz
(45.75 MHz ± 0.5 MHz), the discriminator ad-
justment is performed so that the fifth 100
KHz marker on each side of the pix marker
falls on each peak of the discriminator curve.
9.2.2.4 With the calibration provided by superim-
posing the 100 KHz markers on the AFT dis-
criminator curve, perform the AFT circuit
alignment as indicated by the manufacturer.
NOTE:
Most manufacturers recommend disconnect-
ing the AFT output to the tuner when per-
forming AFT alignment.
9.2.2.5 After the discriminator has been aligned, the
exact discriminator crossover is obtained by
injecting a 45.75 MHz carrier at the signal
injection point. The d-c output voltage of the
AFT circuit is then checked at the AFT test
point using a VTVM. This is performed when
using the 415 by placing the FUNCTION
switch in the MKR position and turning on
the PIX (45.75) marker (all other markers
off). The r-f cable of the Model 415 remains
connected
to the i-f sweep injection point. The
required voltage is then obtained by perform-
ing the specified adjustments.
45.65
45.85
Figure 9.4 Using 100 KHz Markers to Determine
Frequency Separation of Discriminator Peaks
I