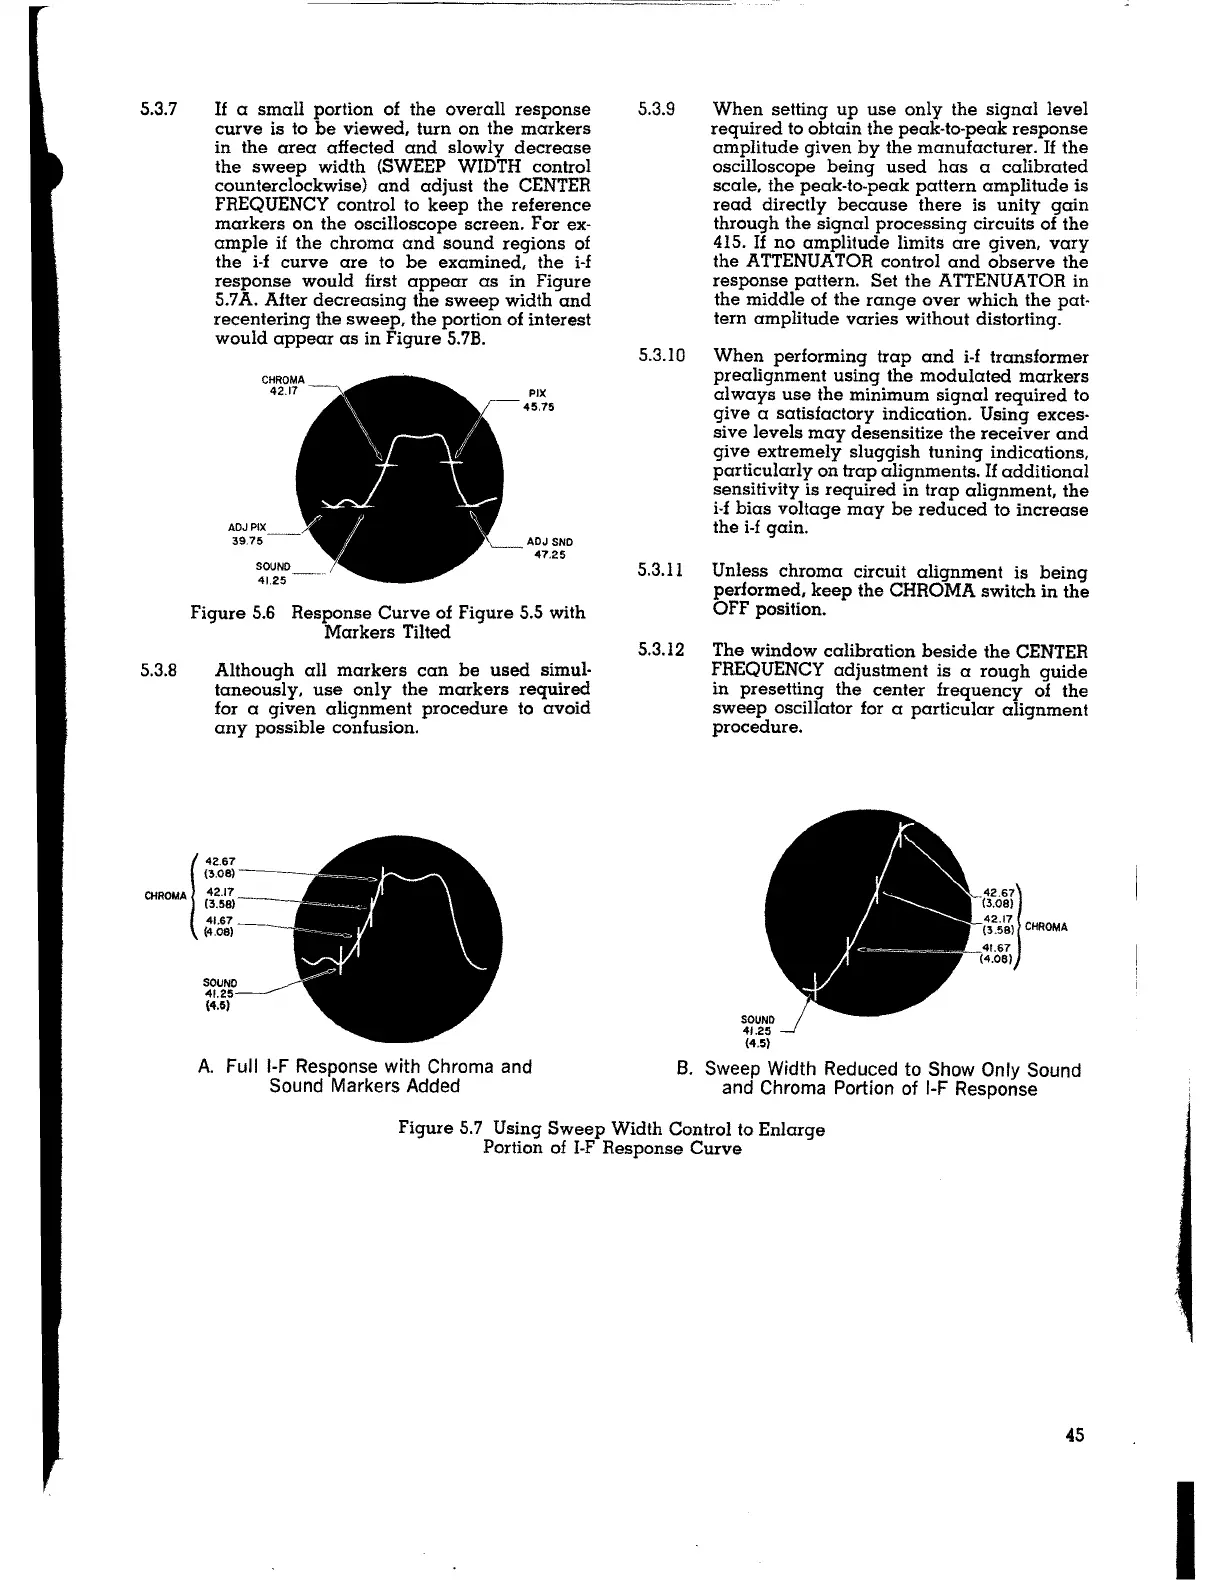
5.3.7
5.3.8
If a small portion of the overall response
curve is to be viewed, turn on the markers
in the area affected and slowly decrease
the sweep width (SWEEP WIDTH control
counterclockwise) and adjust the CENTER
FREQUENCY control to keep the reference
markers on the oscilloscope screen. For ex-
ample if the chroma and sound regions of
the i-f curve are to be examined, the i-f
response would first appear as in Figure
5.7A. After decreasing the sweep width and
recentering the sweep, the portion of interest
would appear as in Figure 5.7B.
CHROMA
42.17 -
PIX
45.75
ADJ PIX
--
39.75
ADJ SND
47.25
SOUND
41.25
Figure 5.6
Response Curve of Figure 5.5 with
Markers Tilted
Although all markers can be used simul-
taneously, use only the markers required
for a given alignment procedure to avoid
any possible confusion.
SOUND
41.25
(4.5)
A. Full 1-F Response with Chroma and
Sound Markers Added
5.3.9
5.3.10
5.3.11
5.3.12
When setting up use only the signal level
required to obtain the peak-to-peak response
amplitude given by the manufacturer. If the
oscilloscope being used has a calibrated
scale, the peak-to-peak pattern amplitude is
read directly because there is unity gain
through the signal processing circuits of the
415.
If no amplitude limits are given, vary
the ATTENUATOR control and observe the
response pattern. Set the ATTENUATOR in
the middle of the range over which the pat-
tern amplitude varies without distorting.
When performing trap and i-f transformer
prealignment using the modulated markers
always use the minimum signal required to
give a satisfactory indication. Using exces-
sive levels may desensitize the receiver and
give extremely sluggish tuning indications,
particularly on trap alignments. If additional
sensitivity is required in trap alignment, the
i-f bias voltage may be reduced to increase
the i-f gain.
Unless chroma circuit alignment is being
performed, keep the CHROMA switch in the
OFF position.
The window calibration beside the CENTER
FREQUENCY adjustment is a rough guide
in presetting the center frequency of the
sweep oscillator for a particular alignment
procedure.
SOUND
41.25
(4.5)
42.67]
(3.08}
42.17
(3.58} CHROMA
41.67
(4.08}
8. Sweep Width Reduced to Show Only Sound
and Chroma Portion of 1-F Response
Figure 5.7 Using Sweep Width Control to Enlarge
Portion of I-F Response Curve
45
I