operator may proceed directly from the i-f
alignment into the chroma alignment without
any additional connections or disconnections
at the receiver. The following outline will
demonstrate this procedure.
8.5.3.1 Connect the r-f cable of the 415 either to the
mixer test point or the antenna terminals de-
pending upon the signal injection point speci-
fied. Set the impedance switch of the r-f
cable terminating pad as required, this being
75 ohms
if the mixer injection point is used or
300 ohms if the antenna terminals are used.
8.5.3.2 Readjust sweep width to display the com-
plete i-f response curve.
8.5.3.3 Turn on the SOUND (41.25) and the three
CHROMA markers (41.67, 42.17 and 42.67).
Set marker amplitude as required.
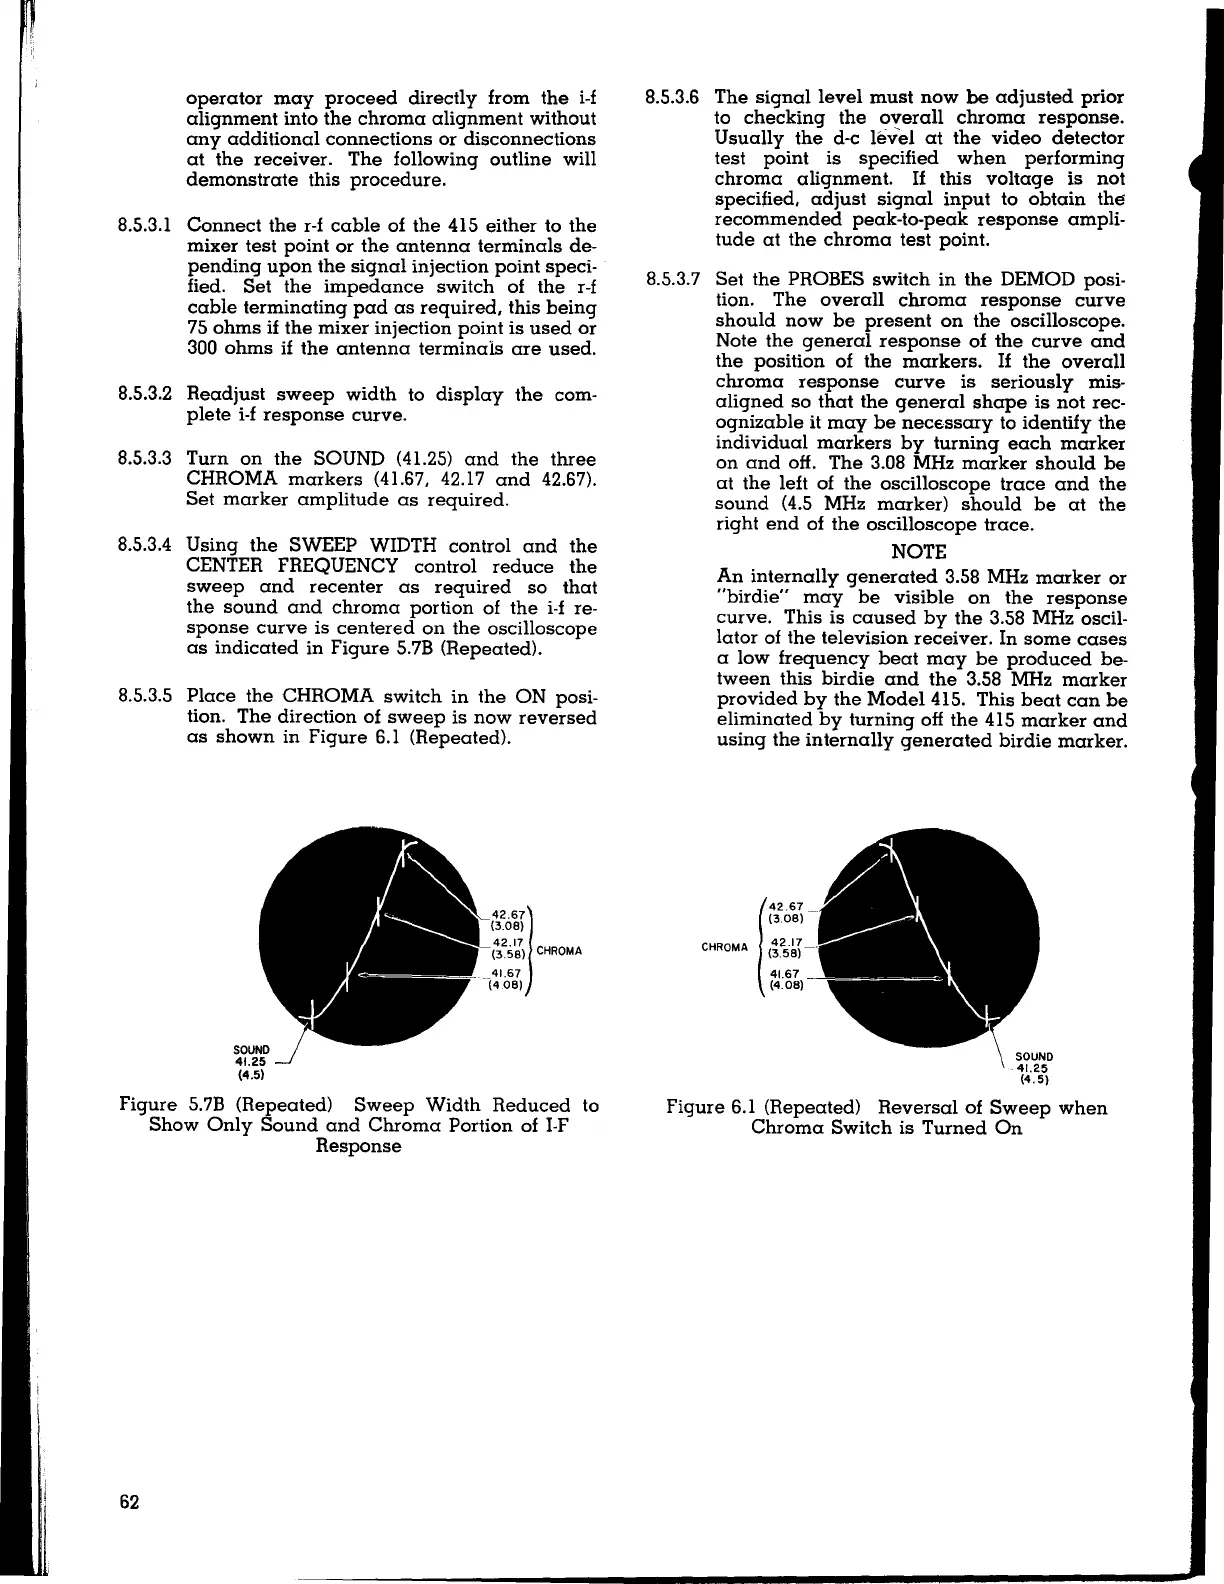
8.5.3.4 Using the SWEEP WIDTH control and the
CENTER FREQUENCY control reduce the
sweep and recenter as required so that
the sound and chroma portion of the i-f re-
sponse curve is centered on the oscilloscope
as indicated in Figure 5.7B (Repeated).
8.5.3.5 Place the CHROMA switch in the ON posi-
tion. The direction of sweep is now reversed
as shown in Figure 6.1 (Repeated).
SOUND
41.25
(4.5)
42.67]
(3.08)
42.17
(3.58) CHROMA
41.67
-(4 08)
Figure 5.7B (Repeated) Sweep Width Reduced to
Show Only Sound and Chroma Portion of I-F
Response
62
8.5.3.6 The signal level must now
be adjusted prior
to checking the overall chroma response.
Usually the d-c
level at the video detector
test point is specified when performing
chroma alignment.
If this voltage is not
specified, adjust signal input to obtain
th~
recommended peak-to-peak response ampli-
tude at the chroma test point.
8.5.3.7 Set the PROBES switch in the DEMOD posi-
tion. The overall chroma response curve
should now be present on the oscilloscope.
Note the general response of the curve and
the position of the markers.
If the overall
chroma response curve is seriously mis-
aligned so that the general shape is not rec-
ognizable it may be necessary to identify the
individual markers by turning each marker
on and off. The 3.08 MHz marker should be
at the left of the oscilloscope trace and the
sound (4.5 MHz marker) should be at the
right end of the oscilloscope trace.
NOTE
An internally generated 3.58 MHz marker or
"birdie" may be visible on the response
curve. This is caused by the 3.58 MHz oscil-
lator of the television receiver. In some cases
a low frequency beat may be produced be-
tween this birdie and the 3.58 MHz marker
provided by the Model 415. This beat can be
eliminated by turning off the 415 marker and
using the internally generated birdie marker.
[
42.67
(308)
-
CHROMA
42
·
17
-·
(3.58)
41.67
(4.08)
SOUND
41.25
(4.5)
Figure 6.1 (Repeated) Reversal of Sweep when
Chroma Switch is Turned On