1 Operational Manual
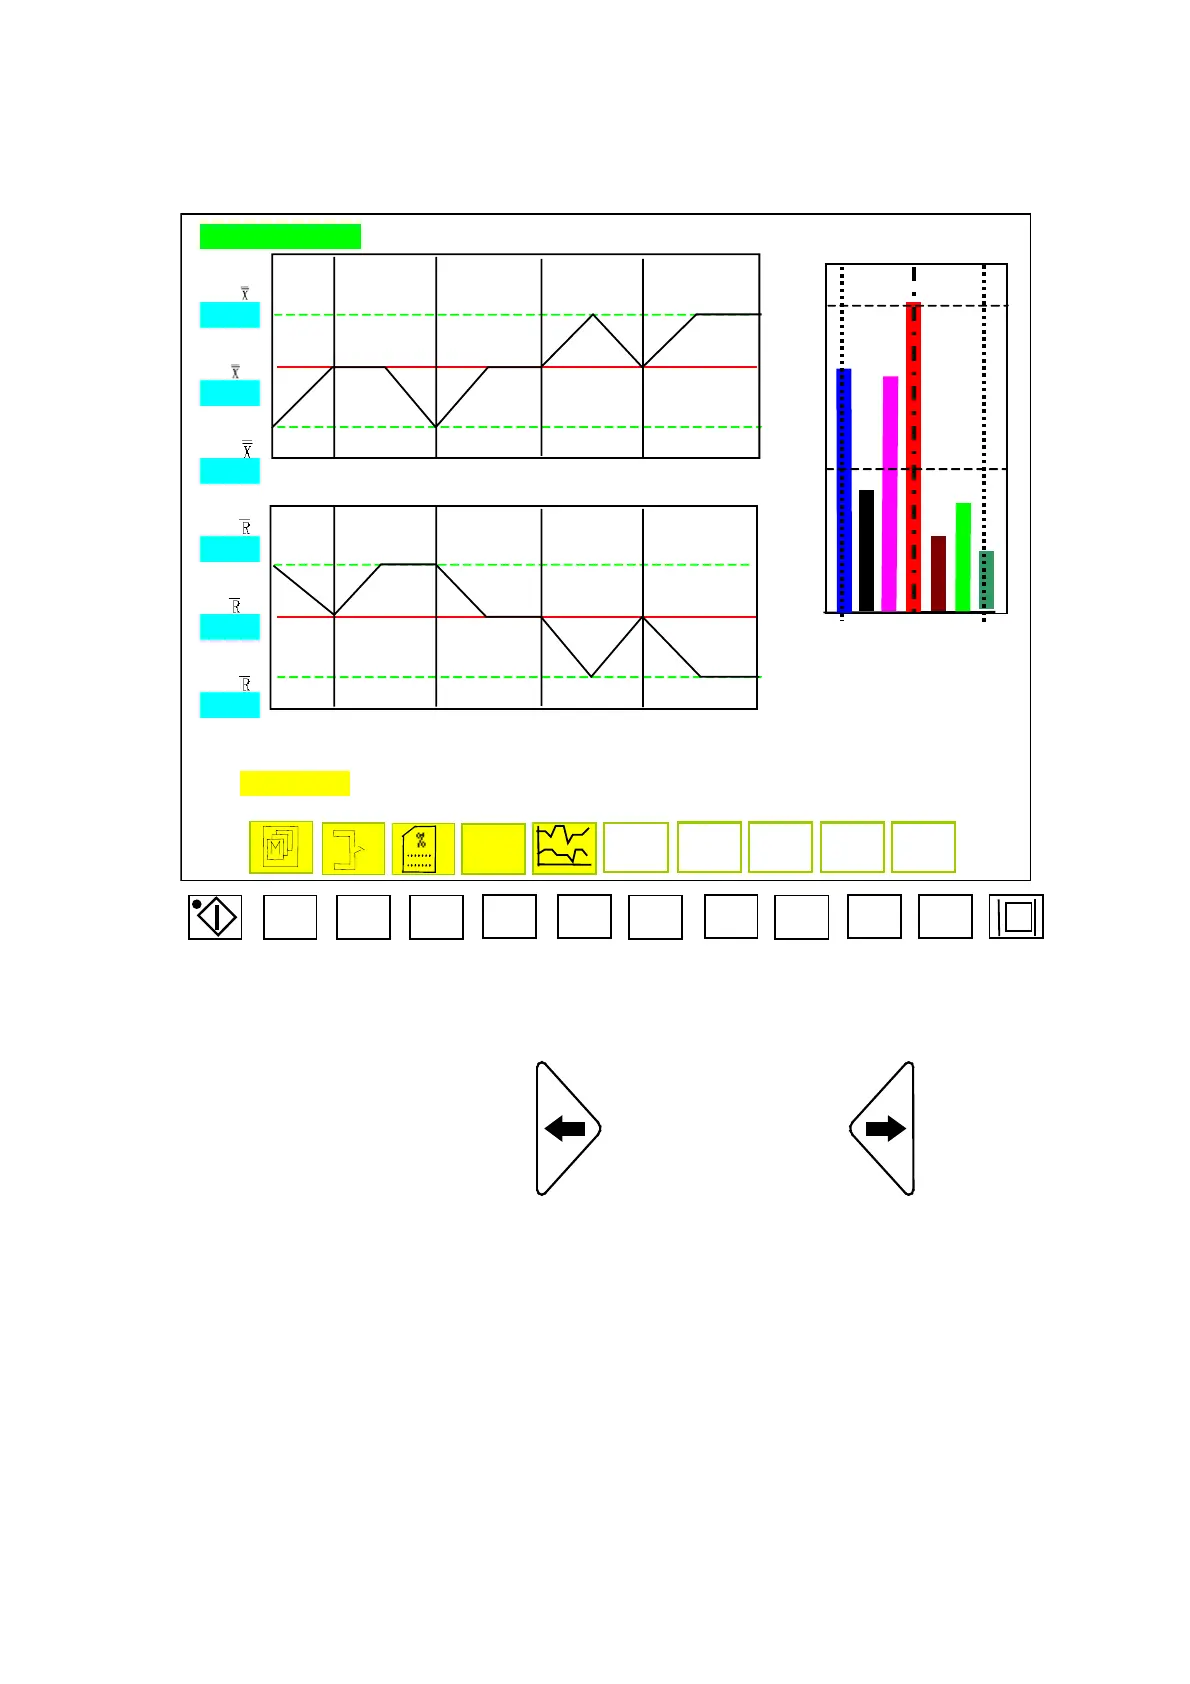
2.34 SPC Display Menu
SPC DIAGRAM
UCL
Aaaaaa 46
CL
bbbbbb
LCL
cccccc
UCL
dddddd
CL
eeeeee SL S SU
LCL
ffffff
CYCLE.T FILLE.T CUSH.T FEED.T FEED.E V/P
F1 F2 F3 F4 F5 F6 F7 F8 F9 F10
Menu 13
This menu is support by the quality record data, whenever 10 molds operation is completed, the mean
value will be calculated and become a file.
cursor to move left and
cursor to move to
right. Function descriptions in menu13 are shown below:
A) Product Cycle: SPC graph is the average time needed for 10 machines to complete a cycle.
B) Filling Time: In auto mode, SPC graph shows the average filling time for every 10 mold.
C) Final step of Injection: Under the auto mode, SPC graph shows the average position of injection’s
final step.
D) Feeding Time: Under the auto mode, SPC graph shows the average position of feeding time for
every 10 mold.
04/08/13
98