1 Operational Manual
E) End-Position of Feeding: In auto mode, draw SPC-curve for average end-position for every 10 mold.
F) V/P Pressure: In auto mode, draw SPC-curve for average oil pressure from filling to holding pressure
for every 10 mold.
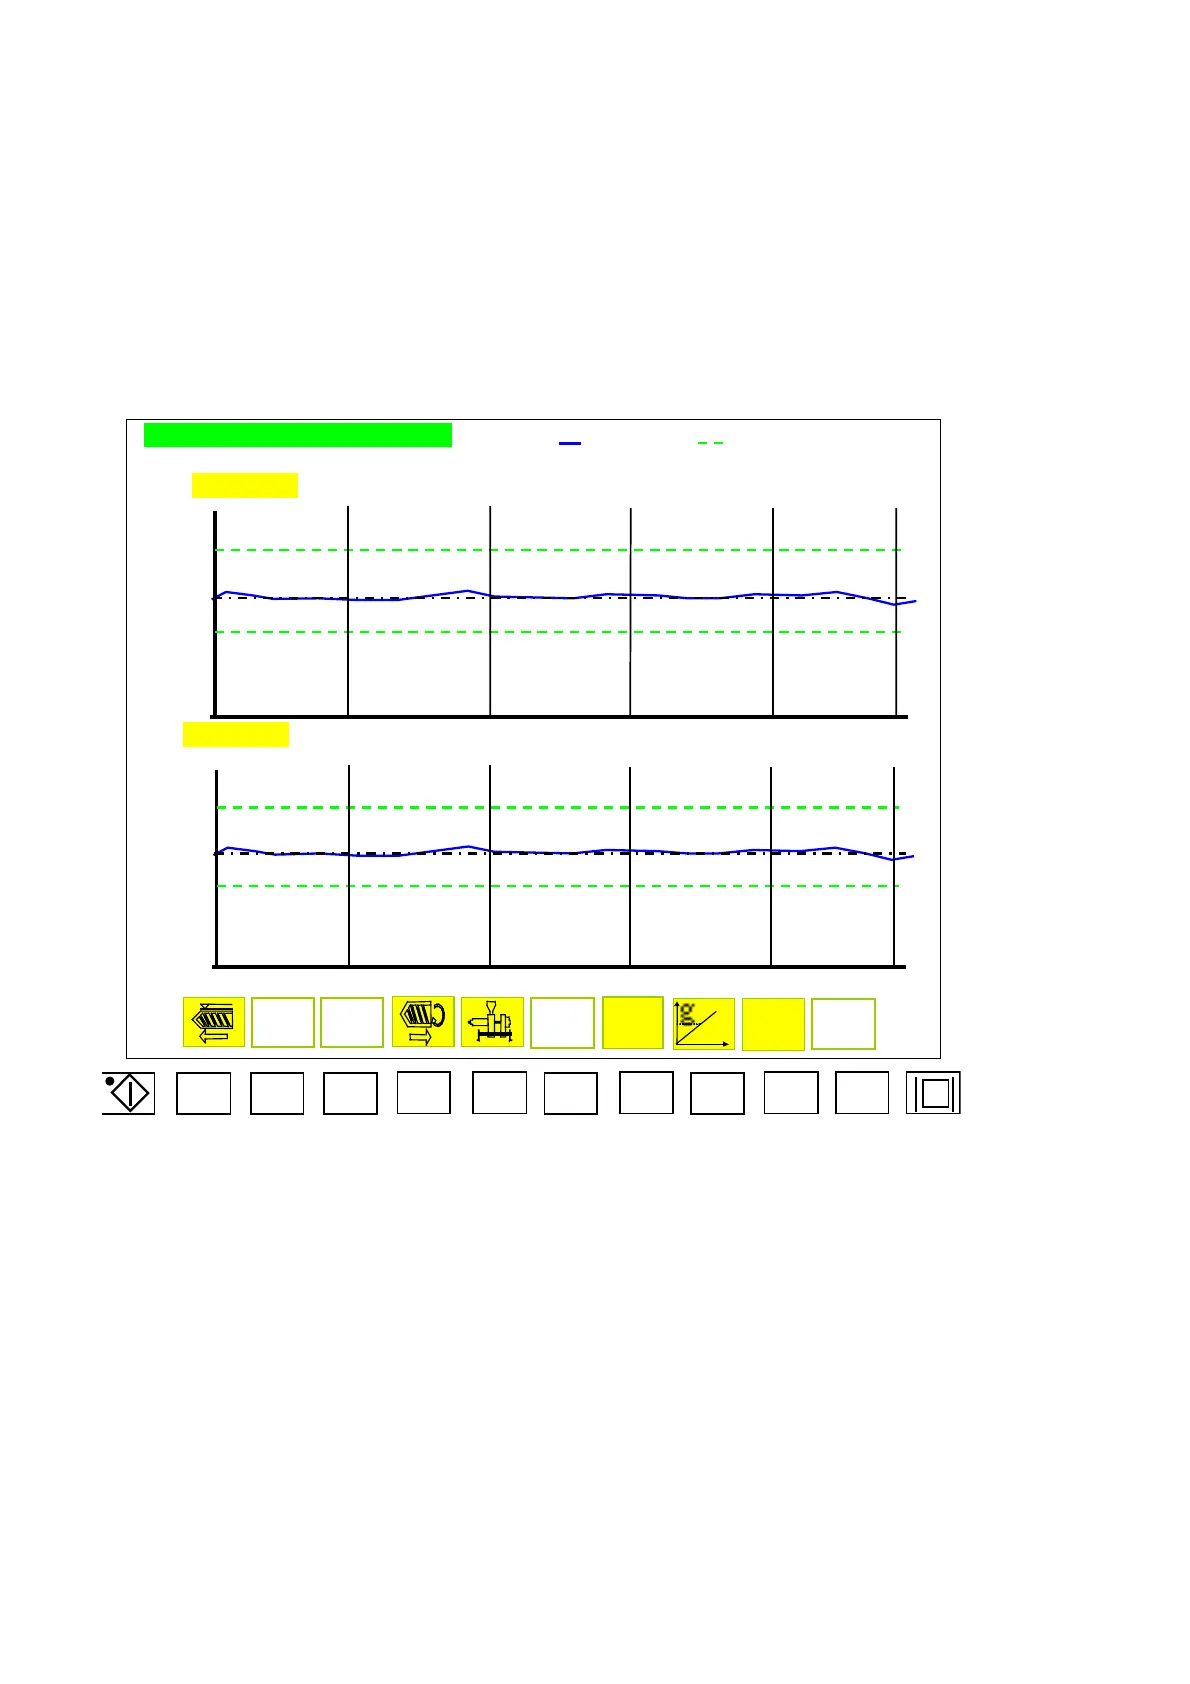
2.35 Quality Curve Display Menu
CUSHION/DOSING TIME CURVE
CYCLE.T FILLE.T CUSH.T FEED.T FEED.E V/P
+
+
SET.VA
-
-
CYCLE.T FILLE.T CUSH.T FEED.T FEED.E V/P
+
+
SET.VA
-
-
SET
Menu 61
F1 F2 F3 F4 F5 F6 F7 F8 F9 F10
This menu is for the quality record, which includes standard and deviation, which is convenient to control
the production quality.
A) Function description in menu 61:
A.a) Product Cycle: In auto mode, record the curve of total infection time for 100 molds.
A.b) Filling Time: In auto mode, record the curve of filling time for 100 molds.
A.c) End Injection: In auto mode, record the end-position of injection for 100 molds.
A.d) Feeding Time: In auto mode, record the curve of feeding time for 100 molds.
A.e) End Feeding: In auto mode, record the end-position of feeding for 100 molds.
A.f) V/P Pressure: In auto mode, 100 molds graphs regarding oil pressure is recorded when filling
material ends and then turns into pressure holding operation.
04/08/13
99