66 ChroMate™ Operator’s Manual Doc. 4300 Rev. E
The samples can now be accepted by clicking on the Accept button. The sample
results will be moved from the Test Results Tab to the Report Tab where they are
automatically stored in the ChroMate database and may be printed in reports.
In Figure 5.3.2-3, a TSH standard curve is displayed. This assay uses a 2
nd
order
polynomial curve fit. Moving the mouse pointer over the plotted curve will display the
fit parameters.
Clicking on the Test Results tab will display the patient results.
This data shows that the first copy of standard 5 appears incorrect. By checking the
boxes to the left of each standard, a corrected curve can be generated.
Once a satisfactory curve is generated, clicking on the Accept Selected button will
cause this curve to be the current standard curve in use and will update the
concentration values of the samples in the Sample Tab. The corrected curve is
displayed. The patient sample results are now updated, which you can see by
clicking on the Test Results tab.
You can now choose to accept or delete any of the sample results by clicking on the
buttons.
Curves can also be adjusted by a percentage factor. This is set by the factor setting
in the calibration tab. Normally this value is set to 0%, and the actual standard curve
absorbance values are used with no adjustment.
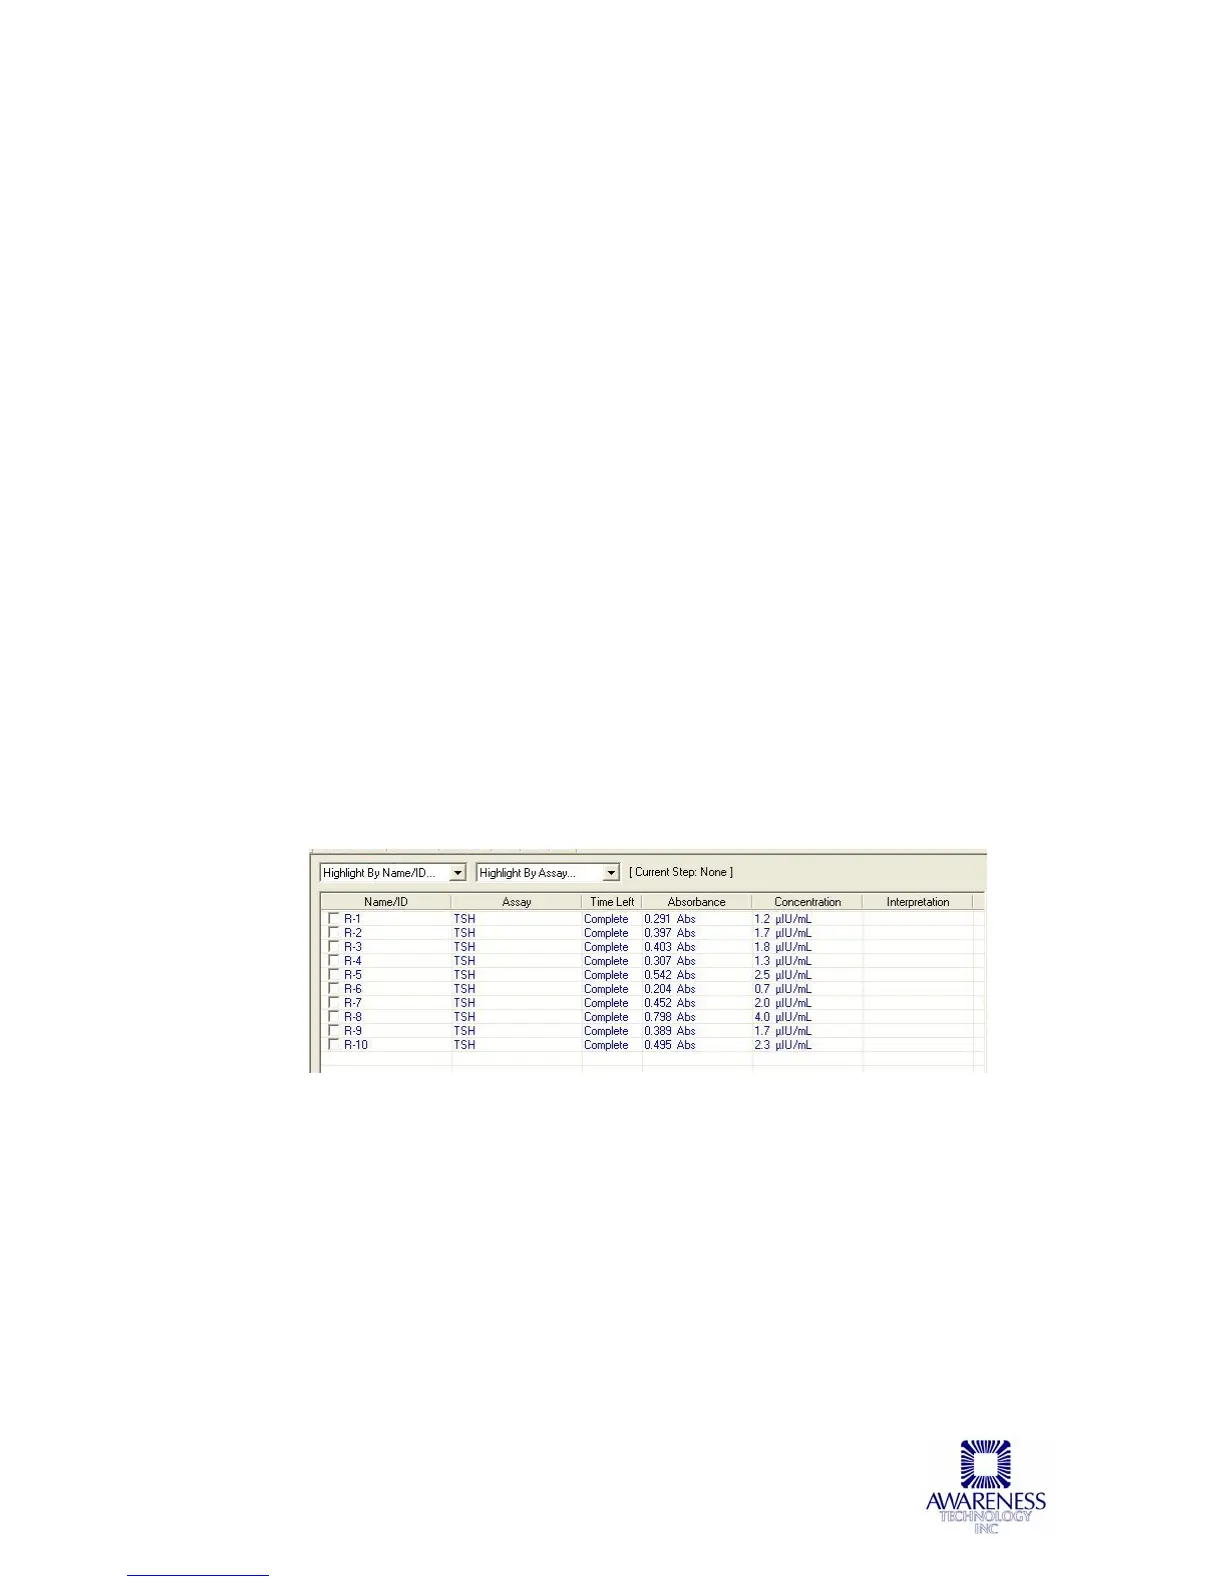
The resulting concentration values for the samples run are shown below in
Figure 5.3.2-4 TSH Results.
Figure 5.3.2-4 TSH Results
 Loading...