ChroMate™ ChroMate™ Operator’s Manual Doc. 4300 Rev. E 67
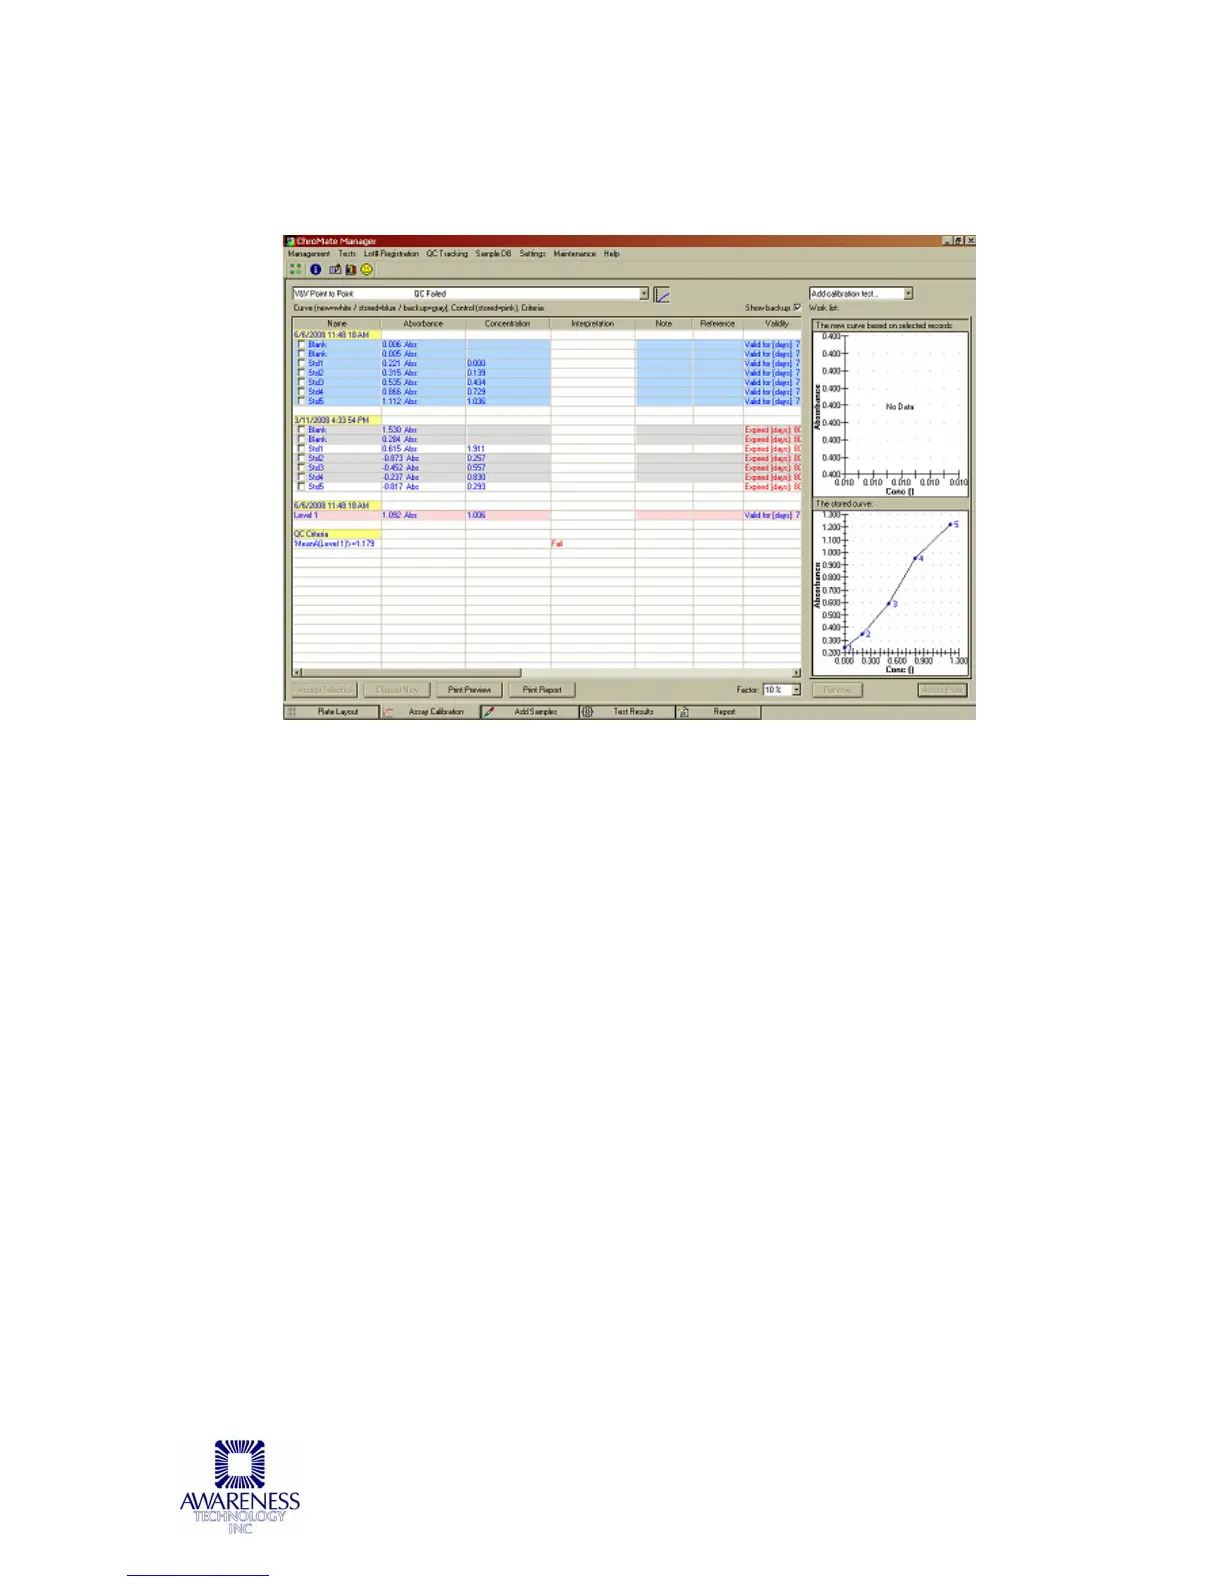
In Figure 5.3.2-5 TSH Curve -10% Factor below the calibration curve is adjusted by
-10%. Factor adjustments occur immediately and do not require clicking on the
Accept Selected button.
Figure 5.3.2-5 TSH Curve -10% Factor
The new concentration values are displayed in the Add Samples Tab.
The percent adjust feature can be used when stored curves are used and there is
evidence that the current run has resulted in increased or decreased absorbance
levels than what is expected.
NOTE: Decreasing the standard curve by a percentage will result in increasing the
sample concentration values.
Less than all the calibrators used in an assay can be run and the stored curve can be
adjusted accordingly. The adjustment factor will be calculated based on the average
percent change of all the new calibrators run compared to their stored absorbance
values. The new curve will be generated from the new calibrator(s) absorbance
values which are currently run and the adjusted absorbance values of the remaining
calibrators from the stored curve. This feature can be used to control for changes in
reagent activity when using stored curves.
By selecting this standard and all the stored standards the new adjusted curve can
be activated.
Once accepted the original absorbance values remain, but the new calculated
concentration values of the standards are displayed.
Even though the samples show decreased absorbance values similar to the one
adjustment standard run, the resulting concentration values for the samples are the
same as when they were run with the original complete standard curve.