5�1�2�1�3�1�1�- Graphic view�
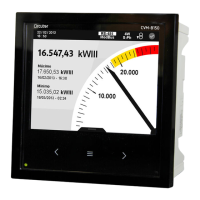
Figure 110 shows the graphical display screen.
Figure 110: Demand parameters, graphical representation (displays 3 parameters)�
>
>
>
<
<
<
varh
8
1
48h
120m
Back
Main
menu
Integration
time
Figure 111: Graphic view menu�
The integration time (X-axis) of the chart can be 120 minutes or 48 hours.
Note: The option selected is not displayed on the menu.
Use the keys and to browse the different options.
To access the option selected press the key .
The menu in the lower area disappears after 3 seconds. Press the key to display the lower
area again.
100
CVM-A1000 - CVM-A1500
Instruction Manual