5�1�4�1�1�- Graphical representation�
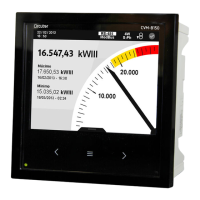
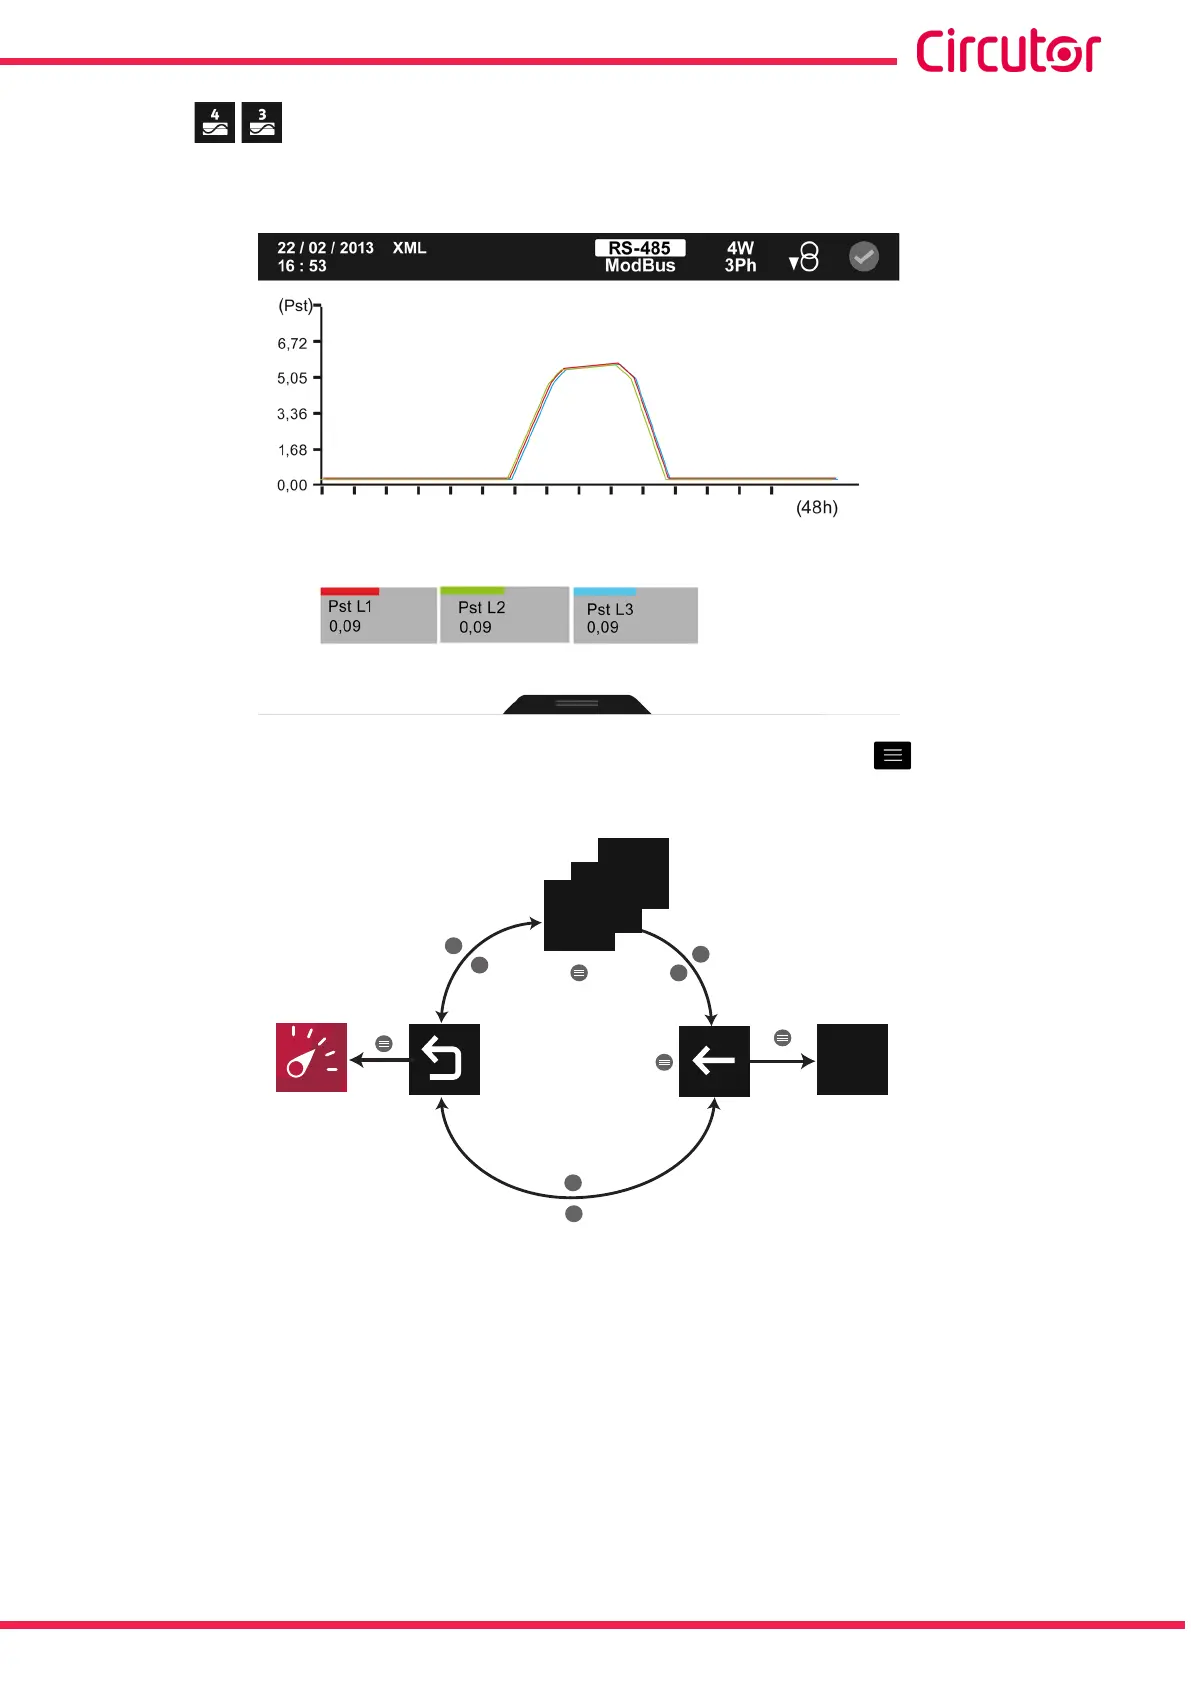
Figure 152 shows the graphical display screen .
Figure 152: Quality parameters: graphical representation�
The menu in the bottom area disappears after a few seconds. Click on the key to display
the lower area again.
300s
>
>
>
<
<
<
varh
8
1
60s
20s
Q
Back
Main
menu
Display / Integration
time
Figure 153: Graphical representation menu (quality parameters)�
For the K-factor, V Peak factor, A Peak factor, % V Unbalance, % V Asymmetry, % A
Unbalance and % A Asymmetry parameters:
The display time (X-axis) of the chart can be 20, 60 or 300 seconds.
Note: The option selected is not displayed on the menu.
For the Pst Flicker parameters:
The integration time (X-axis) of the chart can be 120 minutes or 48 hours.
Note: The option selected is not displayed on the menu.
125
Instruction Manual
CVM-A1000 - CVM-A1500