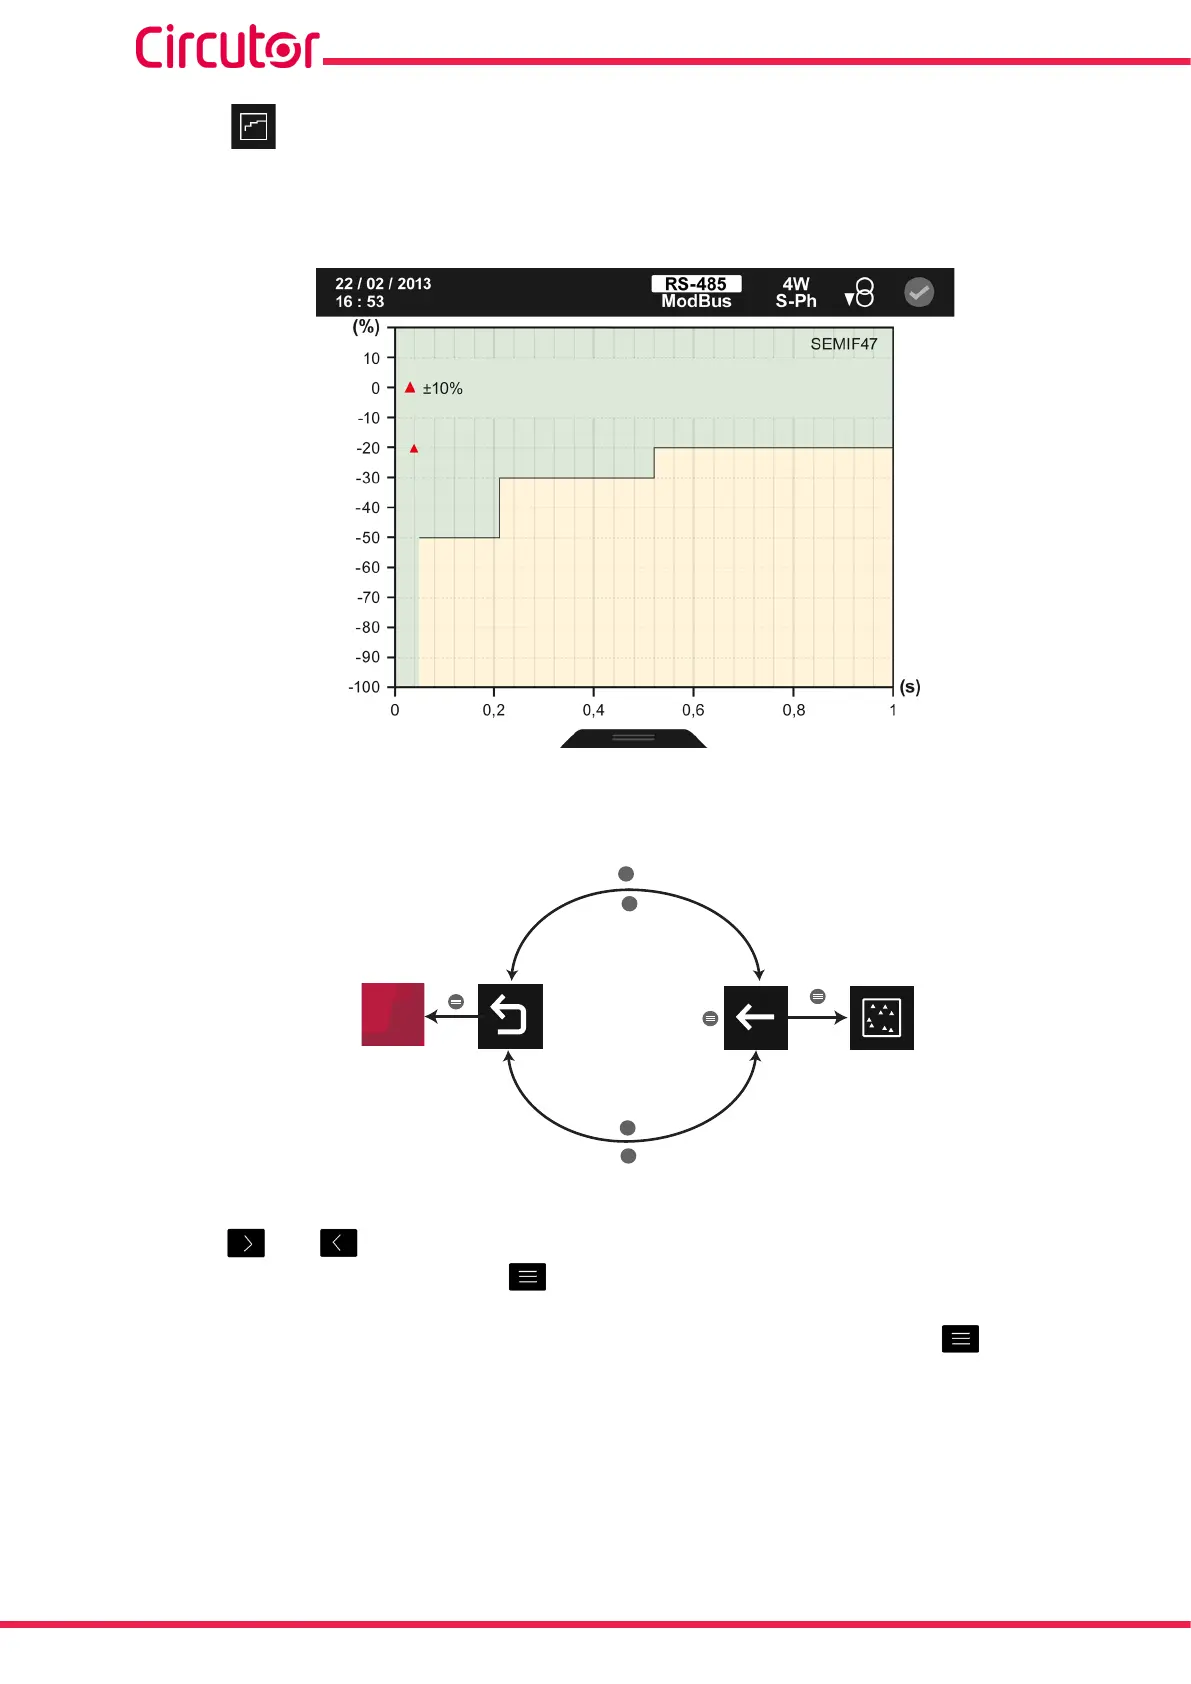
5�2�3�3�- SEMI F47 curve
The screen shown in Figure 198 displays the SEMI F47 curve of all events detected by the de-
vice.
Figure 198: SEMI F47 curve�
Each ▲ indicates an event detected by the device.
>
>
<
<
varh
Q
Back
Main
menu
Figure 199: SEMI F47 curve display menu�
Use the and keys to select the different options.
To conrm the selection, press the key.
The menu in the bottom area disappears after a few seconds. Click on the key to display
the lower area again.
Voltage variation (%Un)
148
CVM-A1000 - CVM-A1500
Instruction Manual