coatmaster Flex
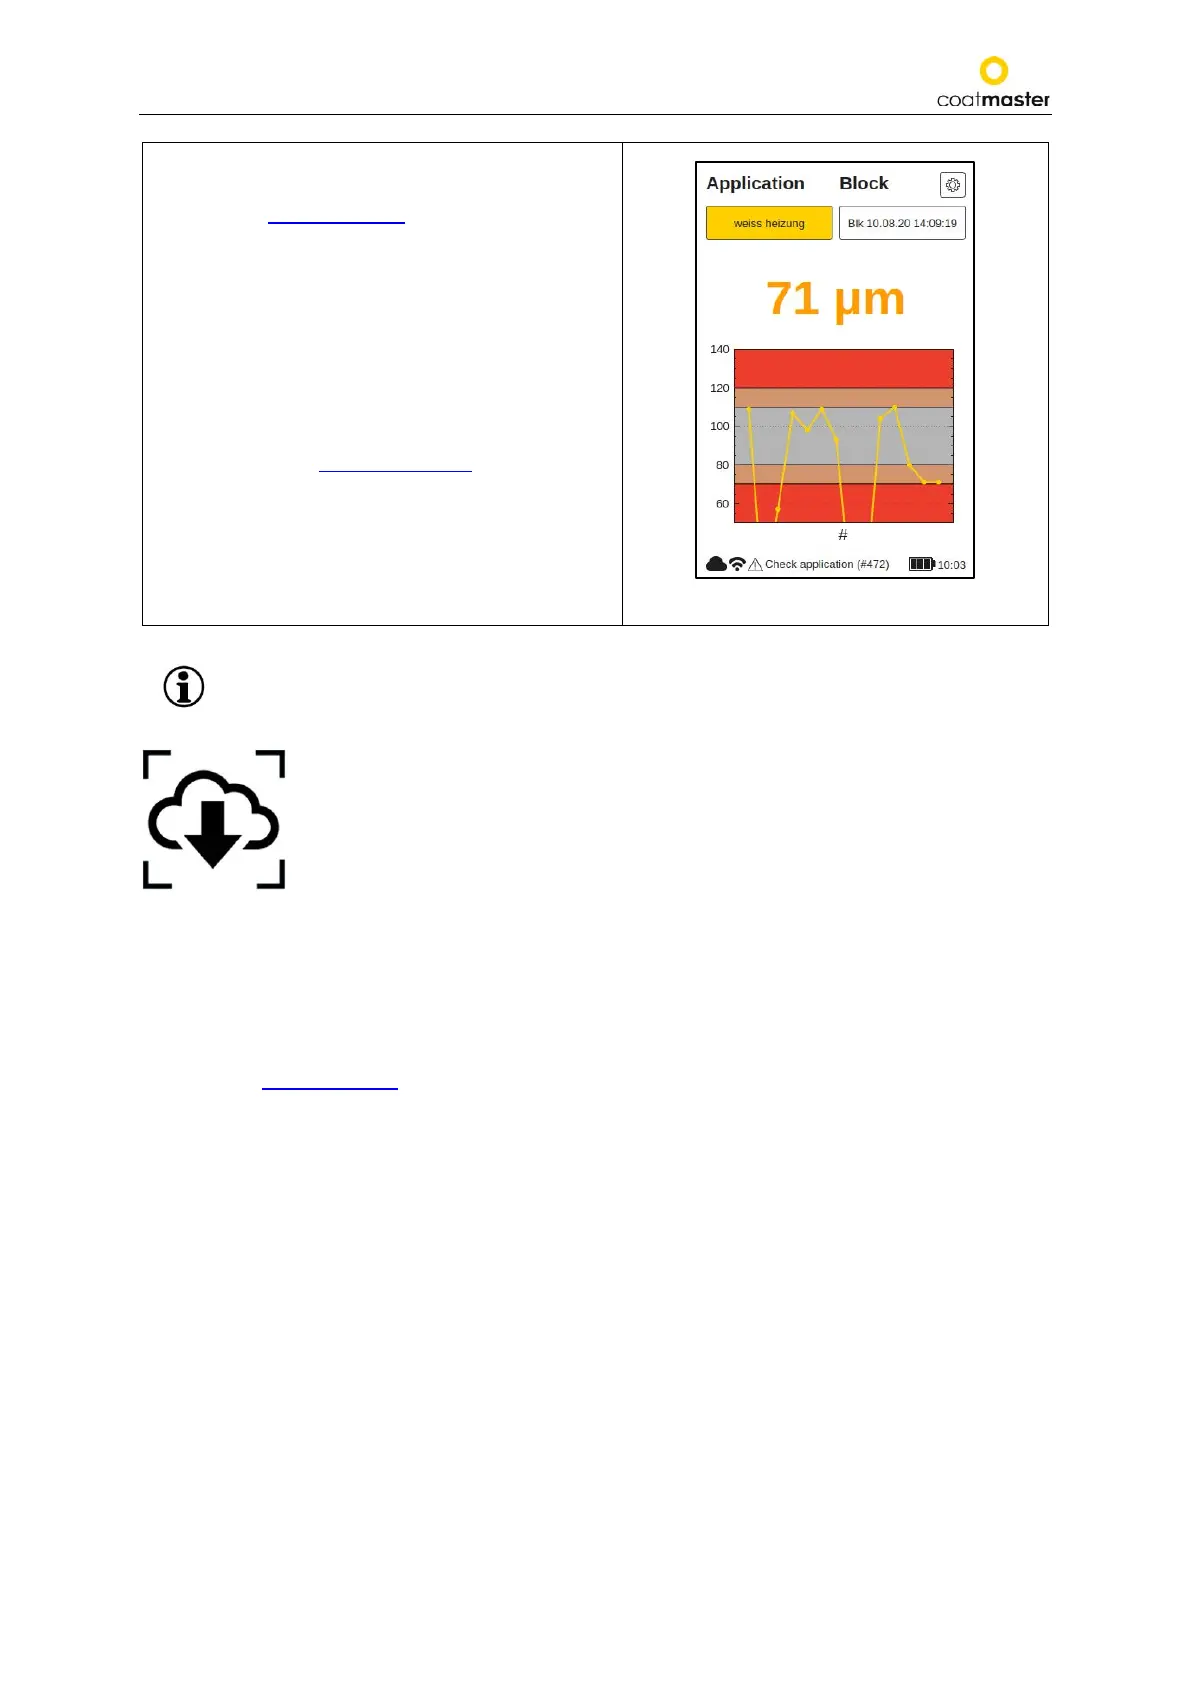
To display a trend chart for your measurements for
the current block, use the down arrow key Ⓓin the
input panel. (see section 7.2.)
Use the up arrow key Ⓓto return to the previous
main menu showing the numeric display.
The chart graphically shows the trend of the last 20
measurements for the selected block.
If a measurement is outside the range bounds, it will
not be displayed on the trend chart!
The vertical axis measurement values are displayed
in the chosen units (see section 8.1.4.).
Figure 57: Trend chart
If the part to be measured is moving, keep up with the movement of the part, so that
the relative movement between the part and the coatmaster® Flex is as small as
possible, thus ensuring a stable measurement.
10. Data Transfer/Cloud
Now that you have made a set of measurements, you may want to process and further analyze the
recorded data. This can be done by accessing your coatmaster® Flex server.
10.1. Login
For a cloud server, you must log in to the coatmaster® cloud on your computer via the Internet to access
the data. Alternatively, if you are using a coatmaster® local server, connect your computer to the local
server Wi-Fi (see section 7.7.). Proceed as follows to access to connect to your server: