coatmaster Flex
8.4.14. Setting Bounds
To understand the relationship between the bounds
in the trend chart, see
Figure 51: Principles of
and the Display Options in the
see Figure 52: Application
).
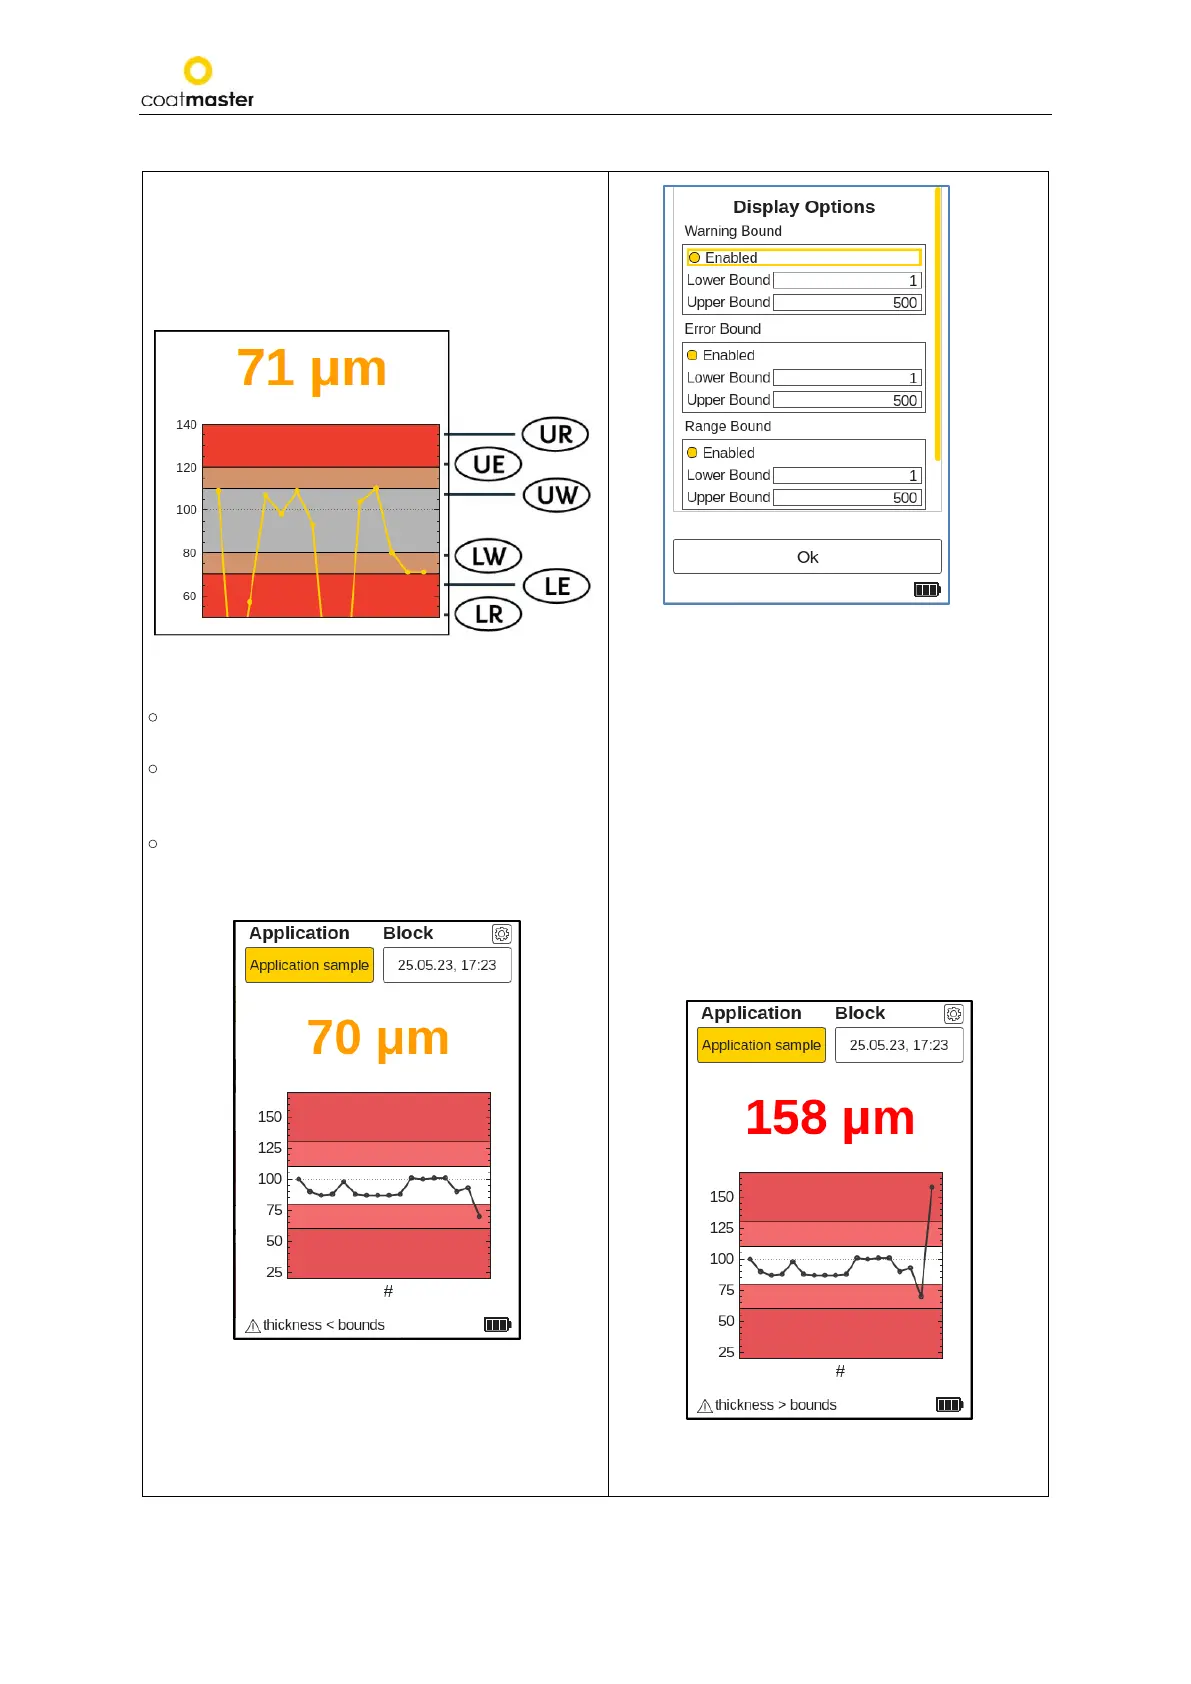
Figure 51: Principles of Application Bounds
•
Measurement values inside the red bands of
the chart are outside quality tolerance levels.
•
Measurement values inside the yellow bands of
the chart are in a warning zone, and corrective
measures for the process must be taken.
•
Measurement values inside the white bands of
the chart are satisfactory. No measure is
required.
Figure 53:
Lower
Warning
Figure
52:
Application Bounds
UR = Upper Range
UE = Upper Error
UW = Upper Warning
LW = Lower Warning
LE = Lower Error
LR = Lower Range
If the measured values are out of range, the
color of the current measurement turn to orange
for a Warning (see Figure 53: Lower Warning)
and to red for an Error (see Figure 54: Upper
Error).
Figure 54: Upper Error
----- UW
----- LE
----- UE
----- LR
----- UR