Monitoring intelliFlow
Digi Connect EZ Mini User Guide
650
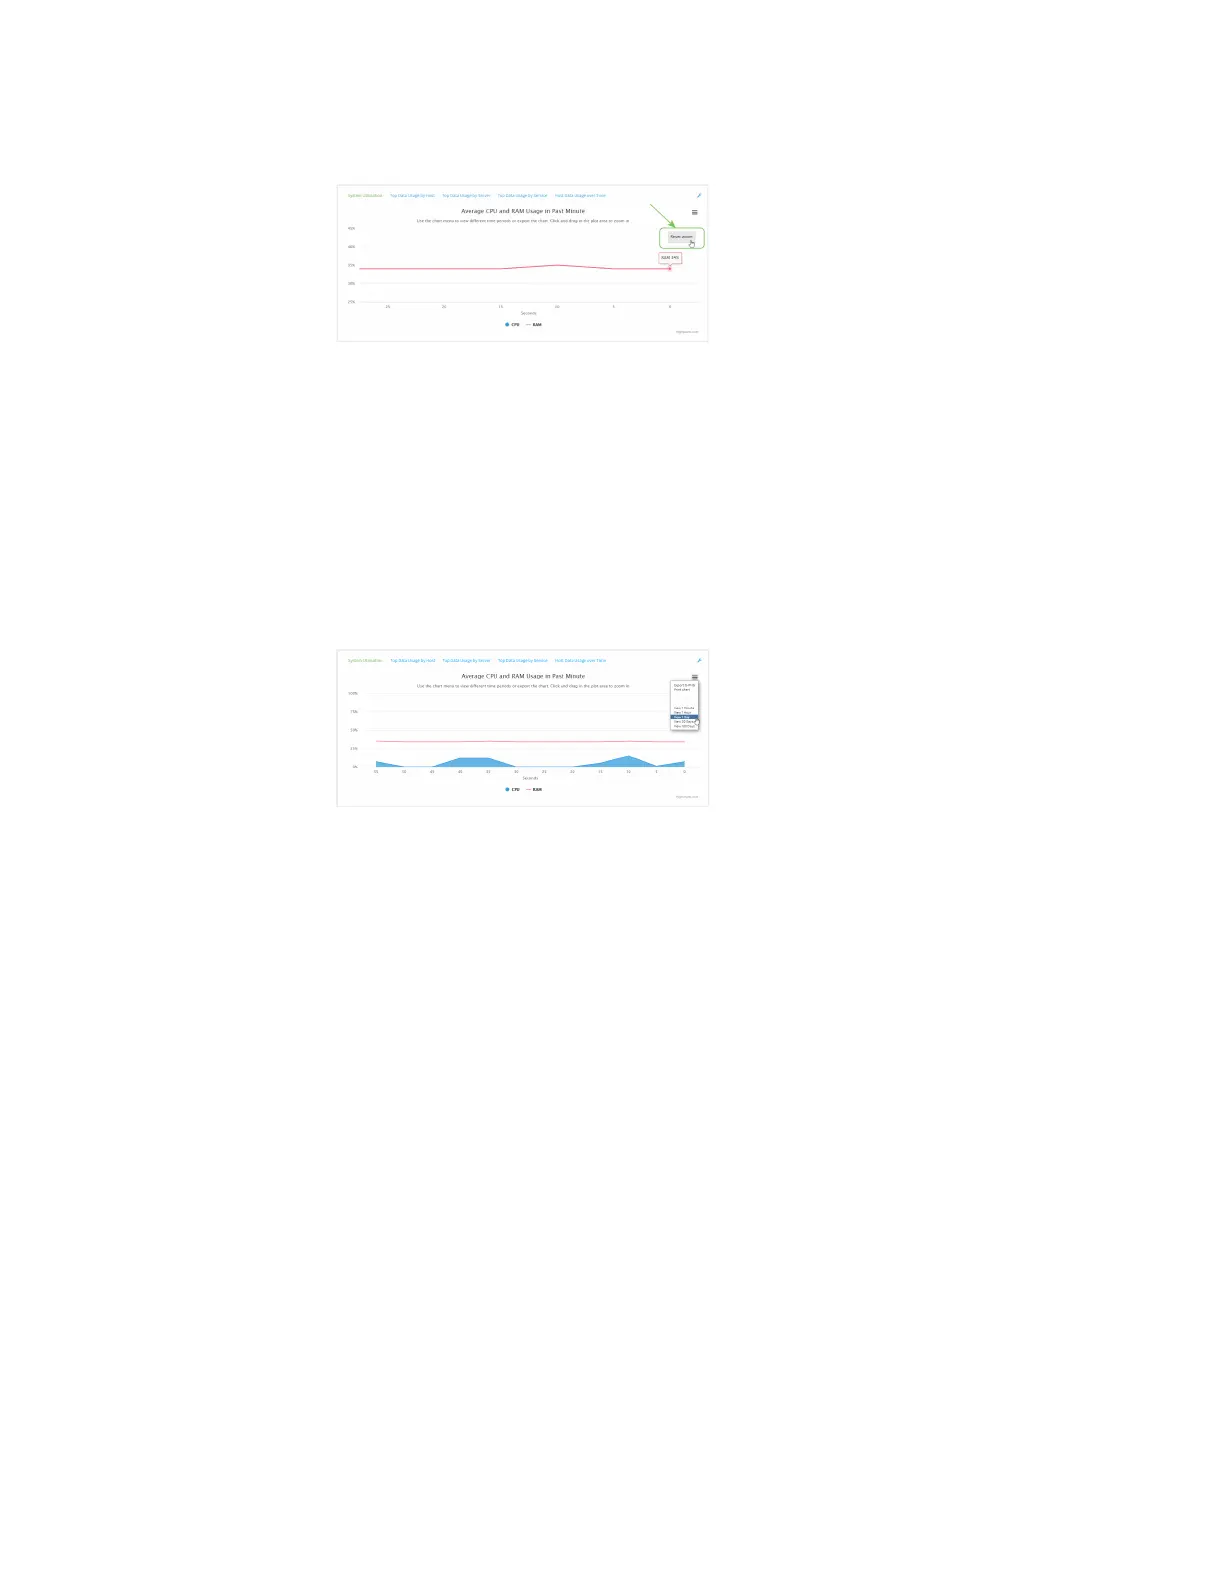
3. Click Reset zoom to return to the original display:
n Change the time period displayed by the chart.
By default, the System utilisation chart displays the average CPUand RAM usage over the
last minute. You can change this to display the average CPUand RAM usage:
l Over the last hour.
l Over the last day.
l Over the last 30 days.
l Over the last 180 days.
1. Click the menu icon ().
2. Select the time period to be displayed.
n Save or print the chart.
1. Click the menu icon ().
2. To save the chart to your local filesystem, select Export to PNG.
3. To print the chart, select Print chart.
Use intelliFlow to display top data usage information
With intelliFlow, you can display top data usage information based on the following:
n Top data usage by host
n Top data usage by server
n Top data usage by service
To generate a top data usage chart:
Web
1. Log into the Connect EZ WebUI as a user with Admin access.
2. If you have not already done so, enable intelliFlow. See Enable intelliFlow.
3. From the menu, click Status > intelliFlow.