User interface
34
Options:
Show temperature graph when checked
Show first derivative graph when checked
Show stage lines when checked
Show weight lines when checked
Display weight loss graph when checked
Display heater temperature when checked
Graph area content
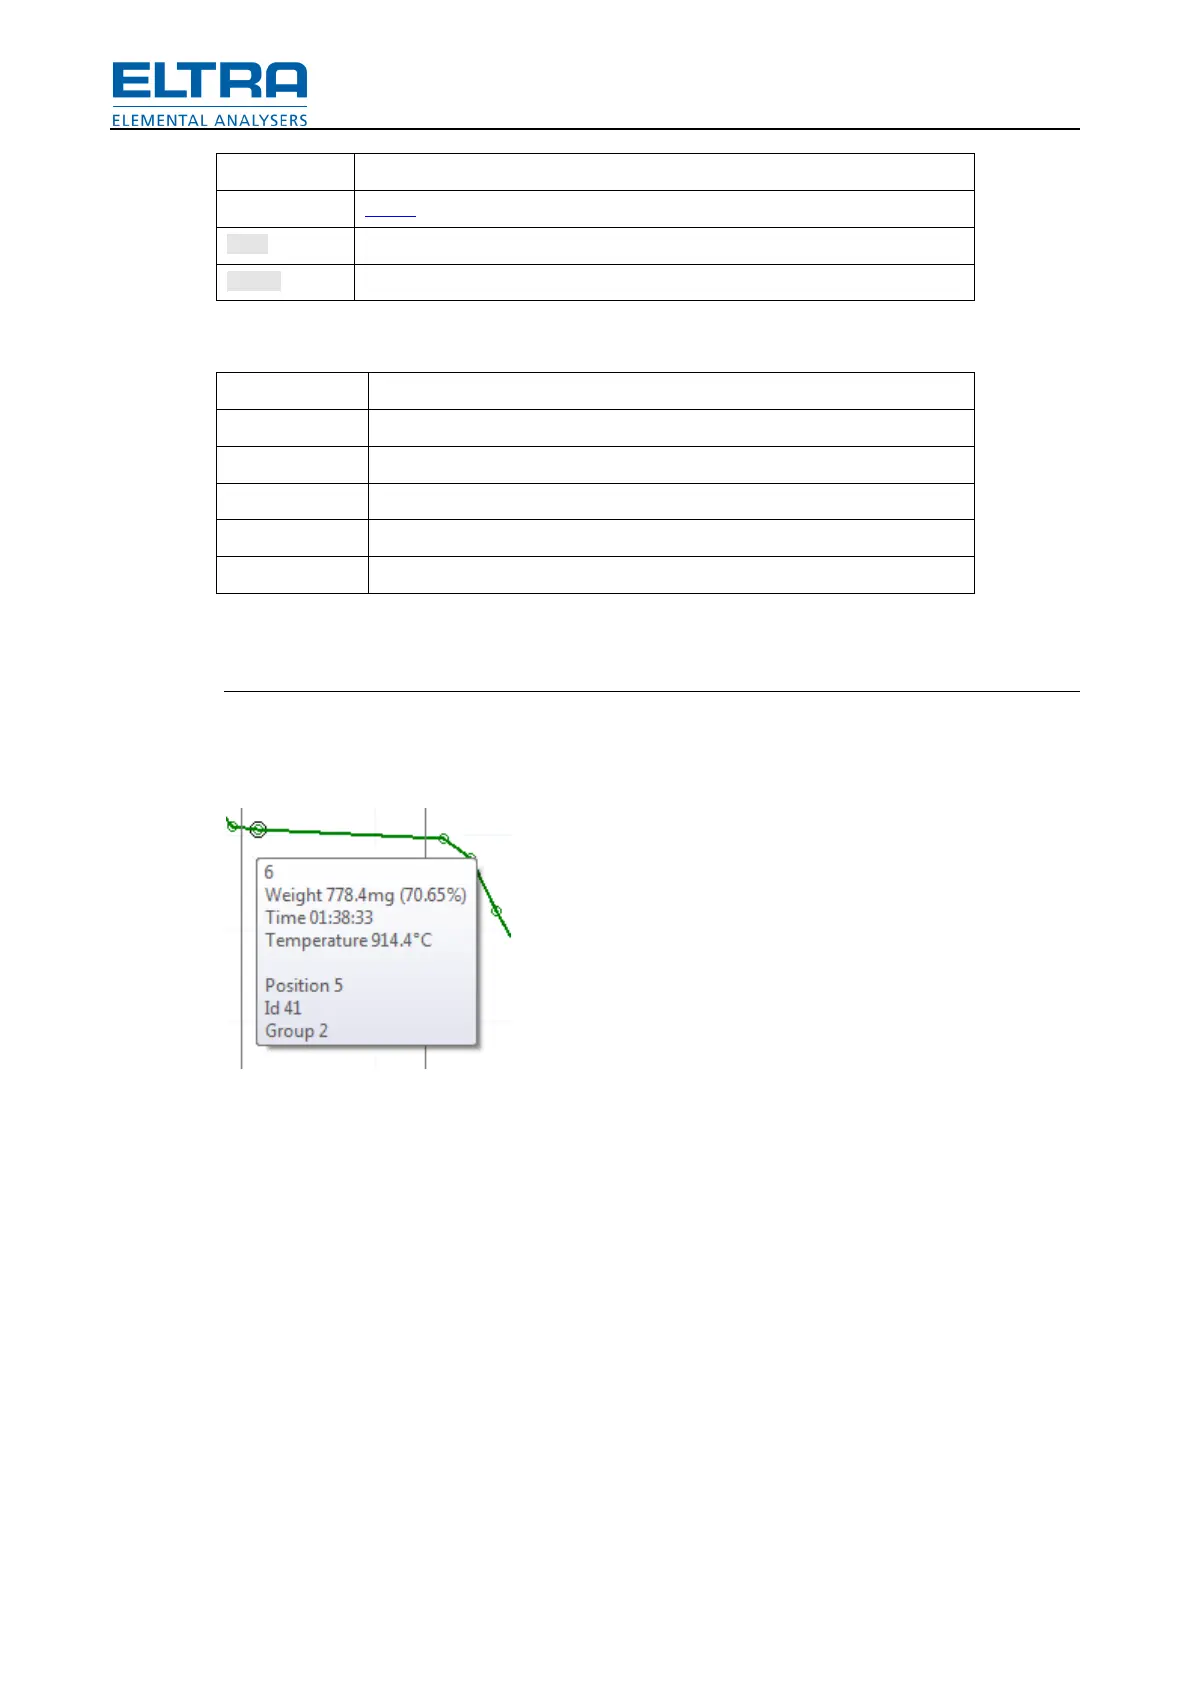
• Weight graph. Sample weights graph. With Loss option checked, a graph of sample
weights related to initial sample weight will be displayed. Mouse-over any point of the
graph for detailed info about this point.
Fig.
: Point info
• Temperature graph. Graph is shown if option Temperature is checked. Option Heater will
toggle between displaying smooth graph of furnace temperature (checked) and
temperature points gathered together with crucible (unchecked).
• First derivative graph. Graph is shown if option Derivative is checked.
• Stage lines. Lines are displayed if option Stages is checked. Vertical black lines show the
time, when a specific stage finished. Mouse-over the point of crossing with zero for
detailed info about this stage.
• Weight lines. Lines are displayed if option Weights is checked. Horizontal lines show the
sample weight at the end of each stage. Mouse-over the point of crossing with zero for
detailed info about this weigh.
 Loading...