SS500e/SS2000e/SS3000e Gas Analyzer
1–6 4900002230 rev. D 2-6-20
by the detector at the end of the beam path of length I (cell length x number
of passes), is given by
,(1)
where N represents the species concentration. Thus, the ratio of the absorption
measured when the laser is tuned on-resonance versus off-resonance is
directly proportional to the number of molecules of that particular species in
the beam path, or
.(2)
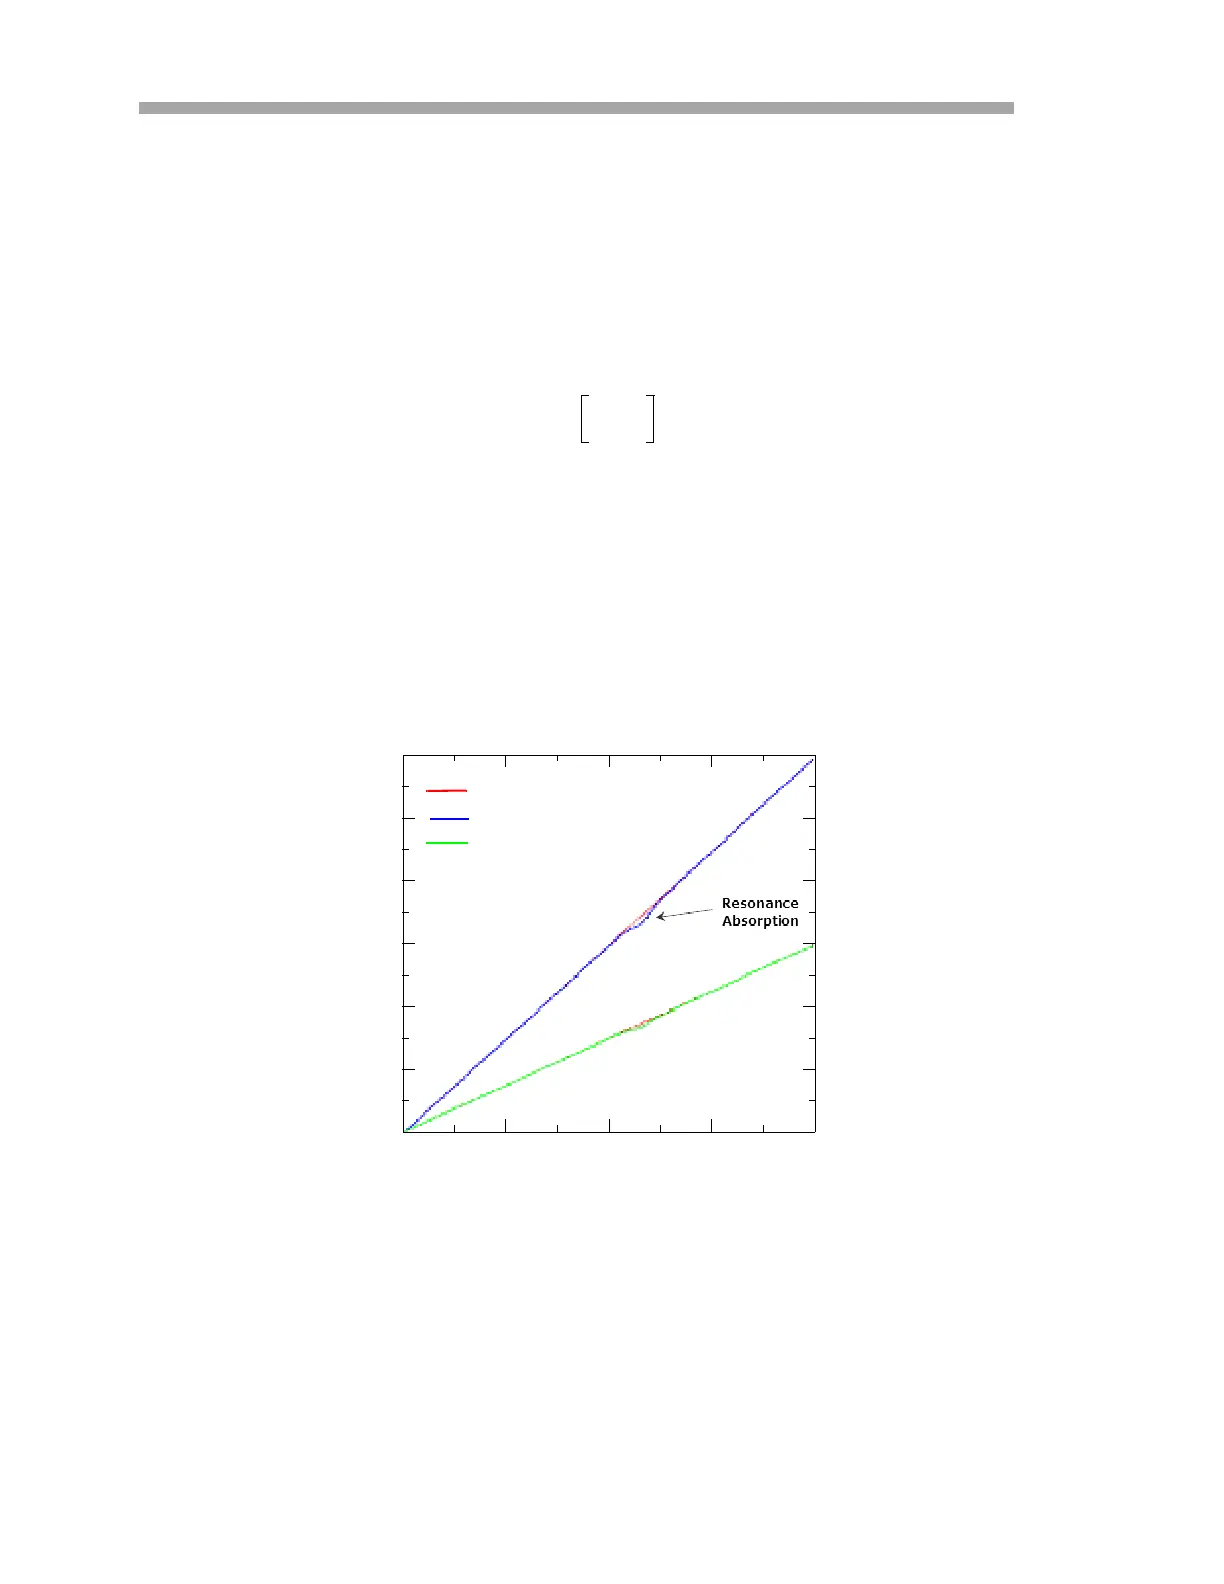
Figure 1–2 shows the typical raw data (in arbitrary units [a.u.]) from a laser
absorption spectrometer scan including the incident laser intensity, I
0
(), and
the transmitted intensity, I(), for a clean system and one with contaminated
mirrors (shown to illustrate the system’s relative insensitivity to mirror
contamination). The positive slope of raw data results from ramping the current
to tune the laser, which not only increases the wavelength with current, but
also causes the corresponding output power to increase. By normalizing the
signal by the incident intensity, any laser output fluctuations are canceled, and
a typical, yet more pronounced, absorption profile results. Refer to Figure 1–3.
Figure 1–2 Typical raw signal from a laser diode
absorption spectrometer with and without mirror
contamination
I I
0
exp lN–=
N
1–
l
--------------
I
I
0
-------------
ln=
3.0
2.5
2.0
1.5
1.0
0.5
Incident Energy I
0
()
Raw Signal, I()
Raw Signal, I()
(Contaminated
Wavelength [a.u.]
Signal [a.u.]
0.0
 Loading...