Rev. 5 – Jun 2020 Page 39 of 91
target point of an ascending or descending CV from the
previous stage value. Please note that if the gate value is
shorter than the stage length, the slide will not be heard
in full. This allows for more subtle nuances while com-
posing and can create some interesting results while
blended with peculiar Gate settings: a fully open gate will
add more dynamic to the composition, while a ratcheting
effect will create an ascending sequence of shorter notes,
similar to a complex embellishment.
3.4.5 Gate Layers
The other two outputs per track (E.3, E.4, E.7, E.8,
E.11, E.12, E.15, E.16) are responsible for the gates. Just
like in the CV channels, each stage can have three differ-
ent Layers and three different Gate Colors. The first layer
determines the number of gates that USTA will play
within each stage, while the second and third layers add
various degrees of variation to the red layer’s value, sim-
ilar to the CV.
Table 7: Gate Layers comparison.
3.4.5.1 Red Gate Layer: Value
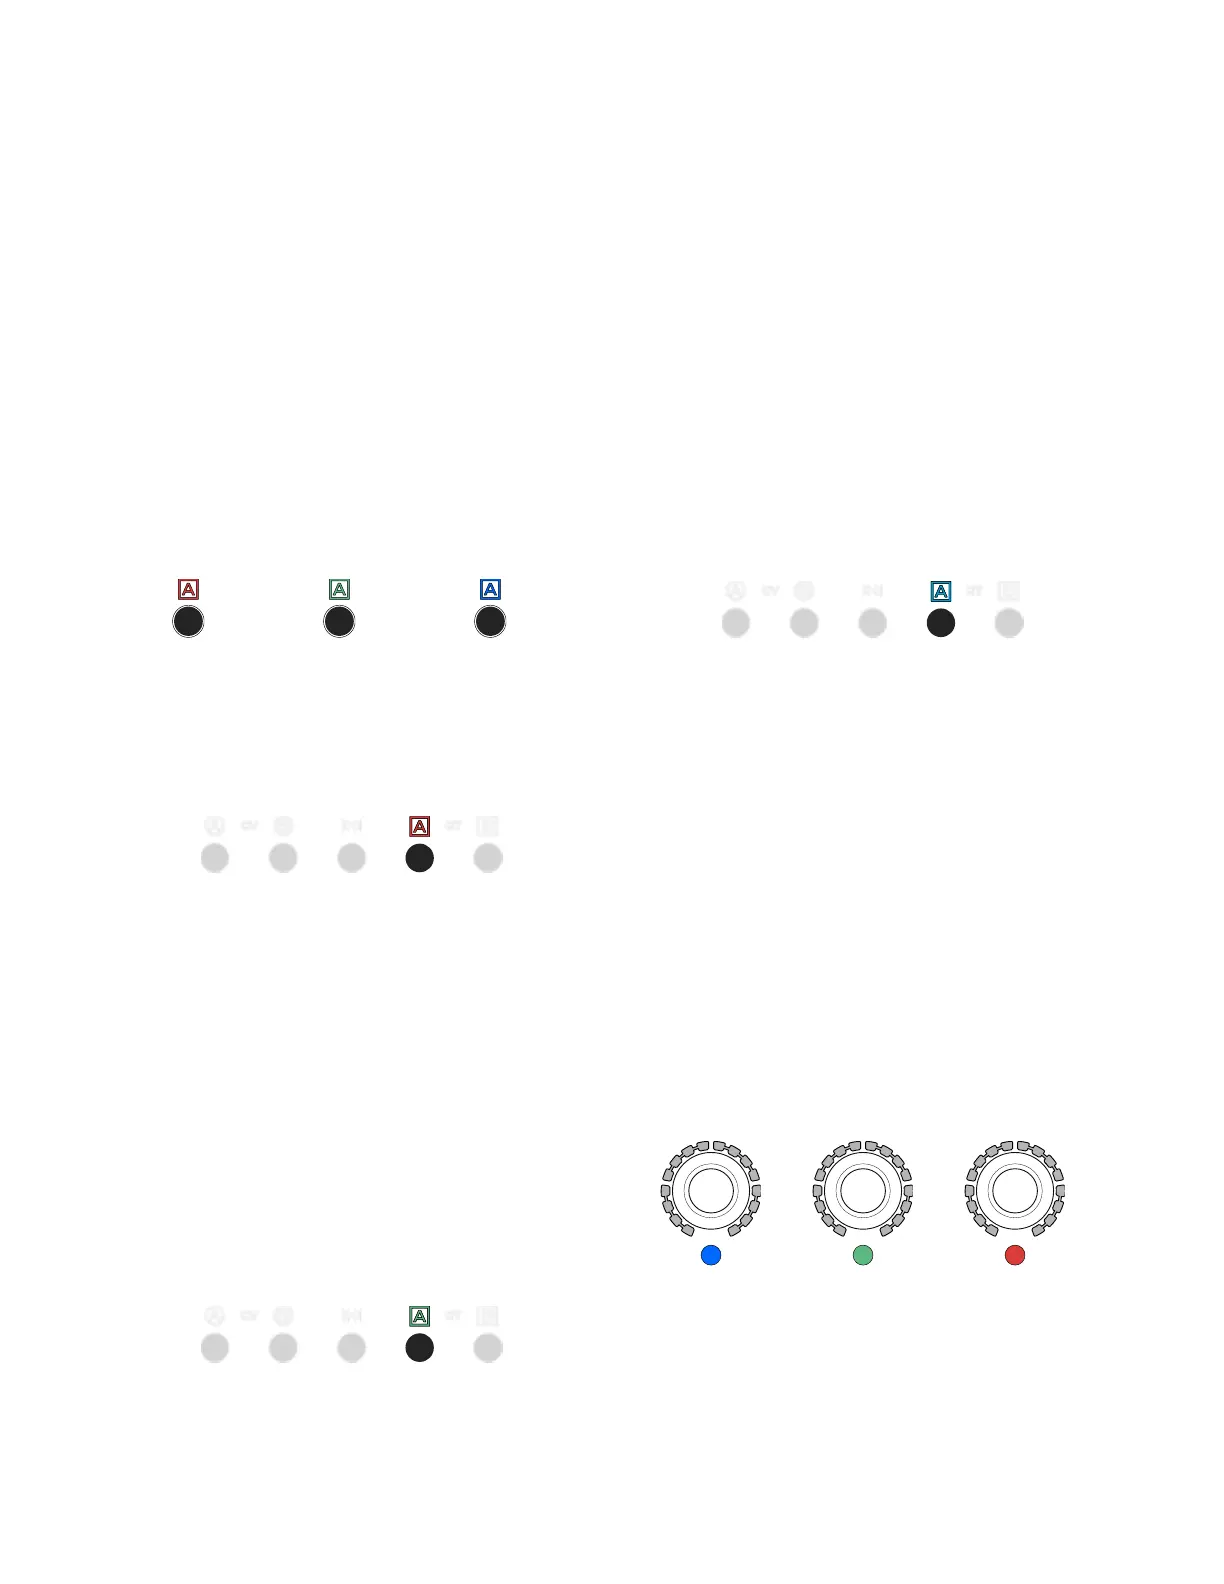
Figure 46: Gate A’s Value layer is selected.
The first layer is active by default. Once a gate channel
is selected (B.9 or B.10), it is marked by a red RGB LED.
It sets the “gate value”, which can be either the gate du-
ration (if the stage color is blue) or the number of individ-
ual gates (ratcheting) that are generated within the stage
length (if the stage color is green). See below §3.4.6 for
the Gate Stage Colors.
In order to edit the gate number, turn the desired Stage
Encoder (A.1) clockwise: it will select a value from 1 to 16,
which is displayed by the Stage Arc surrounding the en-
coder. It is possible to set the gate number to 0: in this
case, no gate will be generated, and the output will re-
main low for the whole stage duration.
3.4.5.2 Green Gate Layer: Variation Index
Figure 47: Gate A’s Variation Index layer is selected.
The second layer is accessed by pushing the channel
button (B.9 or B.10) a second time and it is represented
by a green LED: it controls the probability that USTA
will randomly change the gate number, according to the
range set in the blue (third) layer.
Gate Variation Index works similarly to the CV variation
index layer (see above): the Stage Encoder (A.1), when ro-
tated clockwise, will increase the chance that USTA will
change the value selected in the red layer. By default, no
LED is lit in the Stage Arc (A.2), therefore there are no
chances that USTA will change the gate value. When half
of the LEDs are lit, the chances of a variation are 50-50,
and when all the LEDs are lit it is 100% sure that USTA
will not play the selected gate value: it is still possible,
however, that the previously defined gate value will be
played again as a result of the coin toss, being it still within
the Variation Range (see below).
3.4.5.3 Blue Gate Layer – Variation Range
Figure 48: Gate A’s Variation Range Layer is selected.
The third layer is accessed by pushing the channel but-
ton (B.9 or B.10) a third time and it is represented by a
blue LED: it determines the range of values that USTA
will consider when changing the default value after the
“coin toss” set by the green layer.
The Gate Variation Range layer selects the possible values
that USTA can pick to vary the division of the stage
length when the second layer probability is higher than
zero. 16 numbers are possible, displayed by the Stage Arc
(A.2) around the encoder. The default value is 0 (no LEDs
are lit).
For instance, if the gate number in the red layer is 2,
and a variation range of 8 is selected, USTA will pick a
pseudo-random number between −6 (2-8) and 10 (2+8).
Every negative result corresponds to a gate-off (i.e. a
pause).
3.4.6 Gate Stage Colors