EasyManuals Logo

Furuno NAVnet TZtouch2 User Manual

Furuno NAVnet TZtouch2
367 pages
To Next Page IconTo Next Page
To Previous Page IconTo Previous Page
Page #209 background imageLoading...
Page #209 background image
7. FISH FINDER (SOUNDER)
7-18
7.15 Temperature Graph
With connection of a water temperature sensor, you can plot sea surface temperature
over time. Open the pop-up menu and turn on [Temperature]. The temperature graph
runs across the screen from right to left, the latest temperature at the right edge. The
temperature scale is at the left edge of the display. The unit of measurement (°C or
°F) can be selected with [Temperature] in the [Units] menu.
Temperature scale
Temperature graph
(
S
)
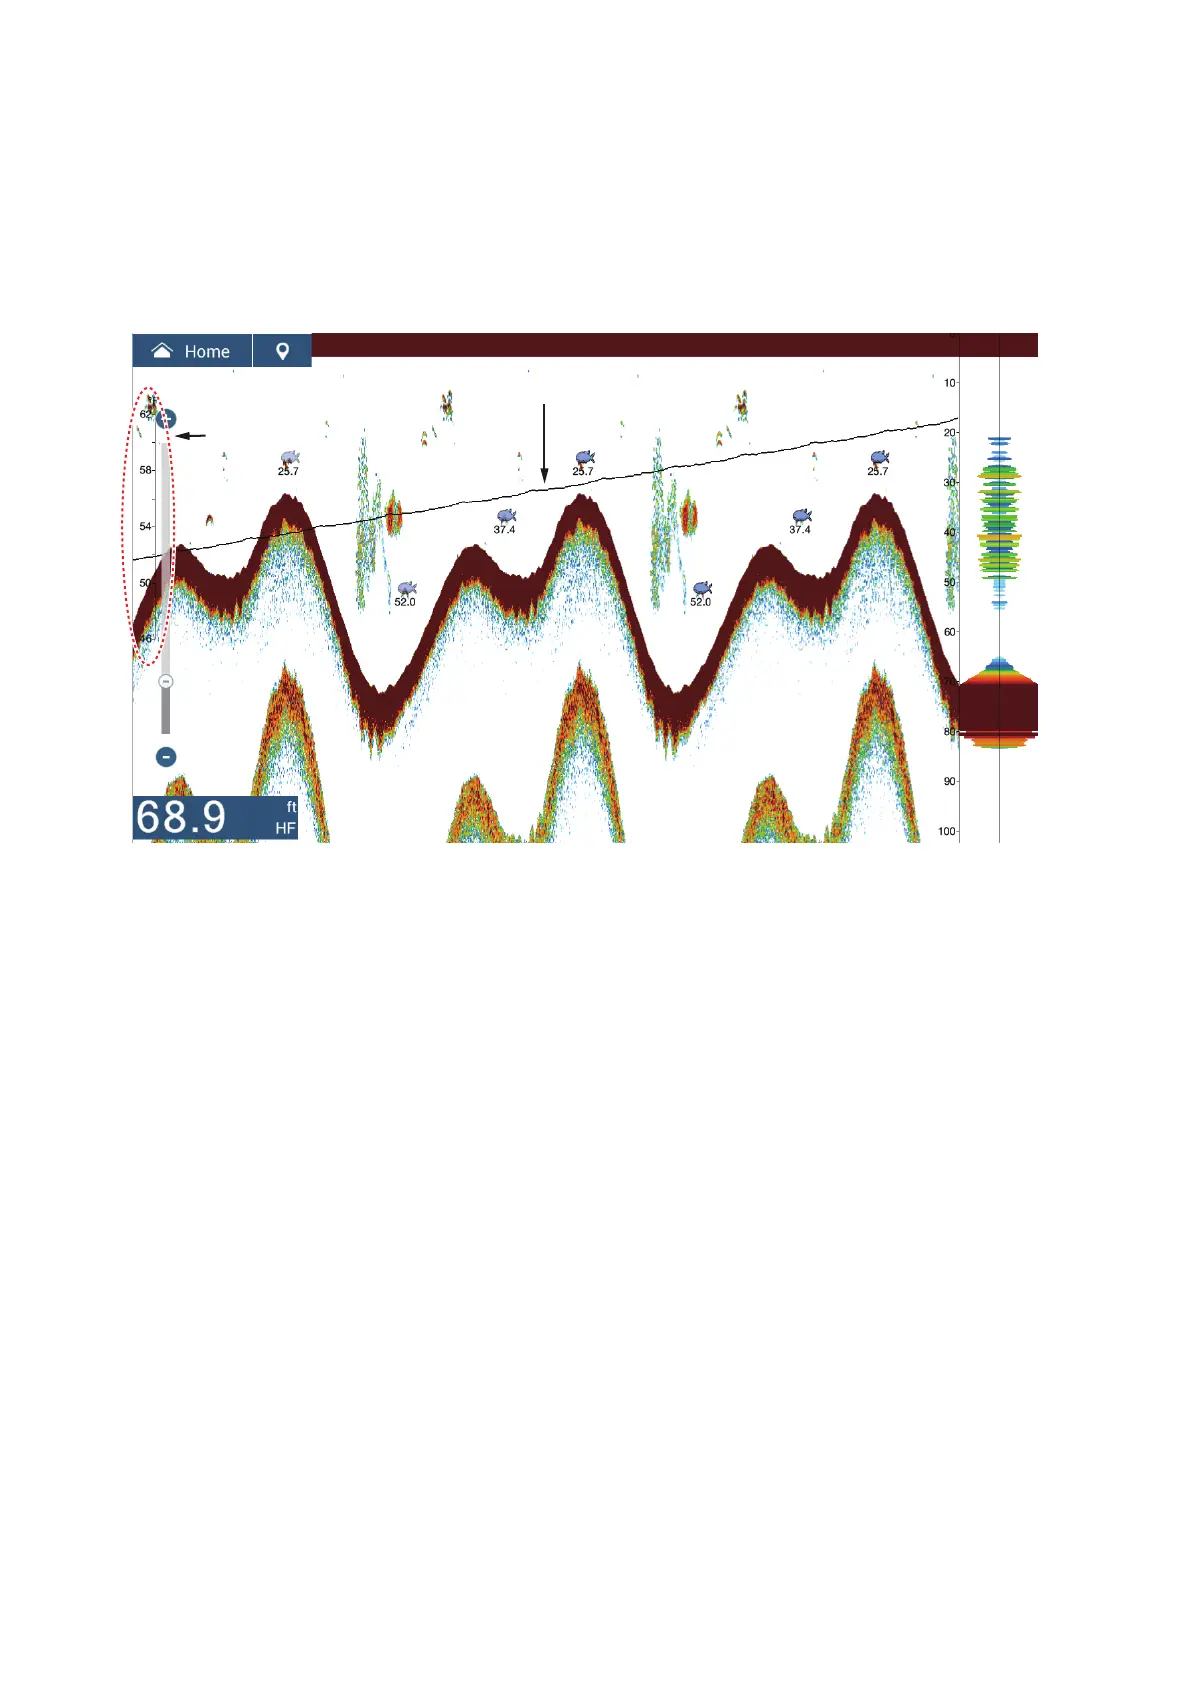
Table of Contents

Other manuals for Furuno NAVnet TZtouch2

Questions and Answers:

Question and Answer IconNeed help?

Do you have a question about the Furuno NAVnet TZtouch2 and is the answer not in the manual?

Furuno NAVnet TZtouch2 Specifications

General IconGeneral
BrandFuruno
ModelNAVnet TZtouch2
CategoryMonitor
LanguageEnglish

Related product manuals