Smartdop
®
30EX Basic Operation
4
2. WAVEFORM PATTERN ANALYSIS
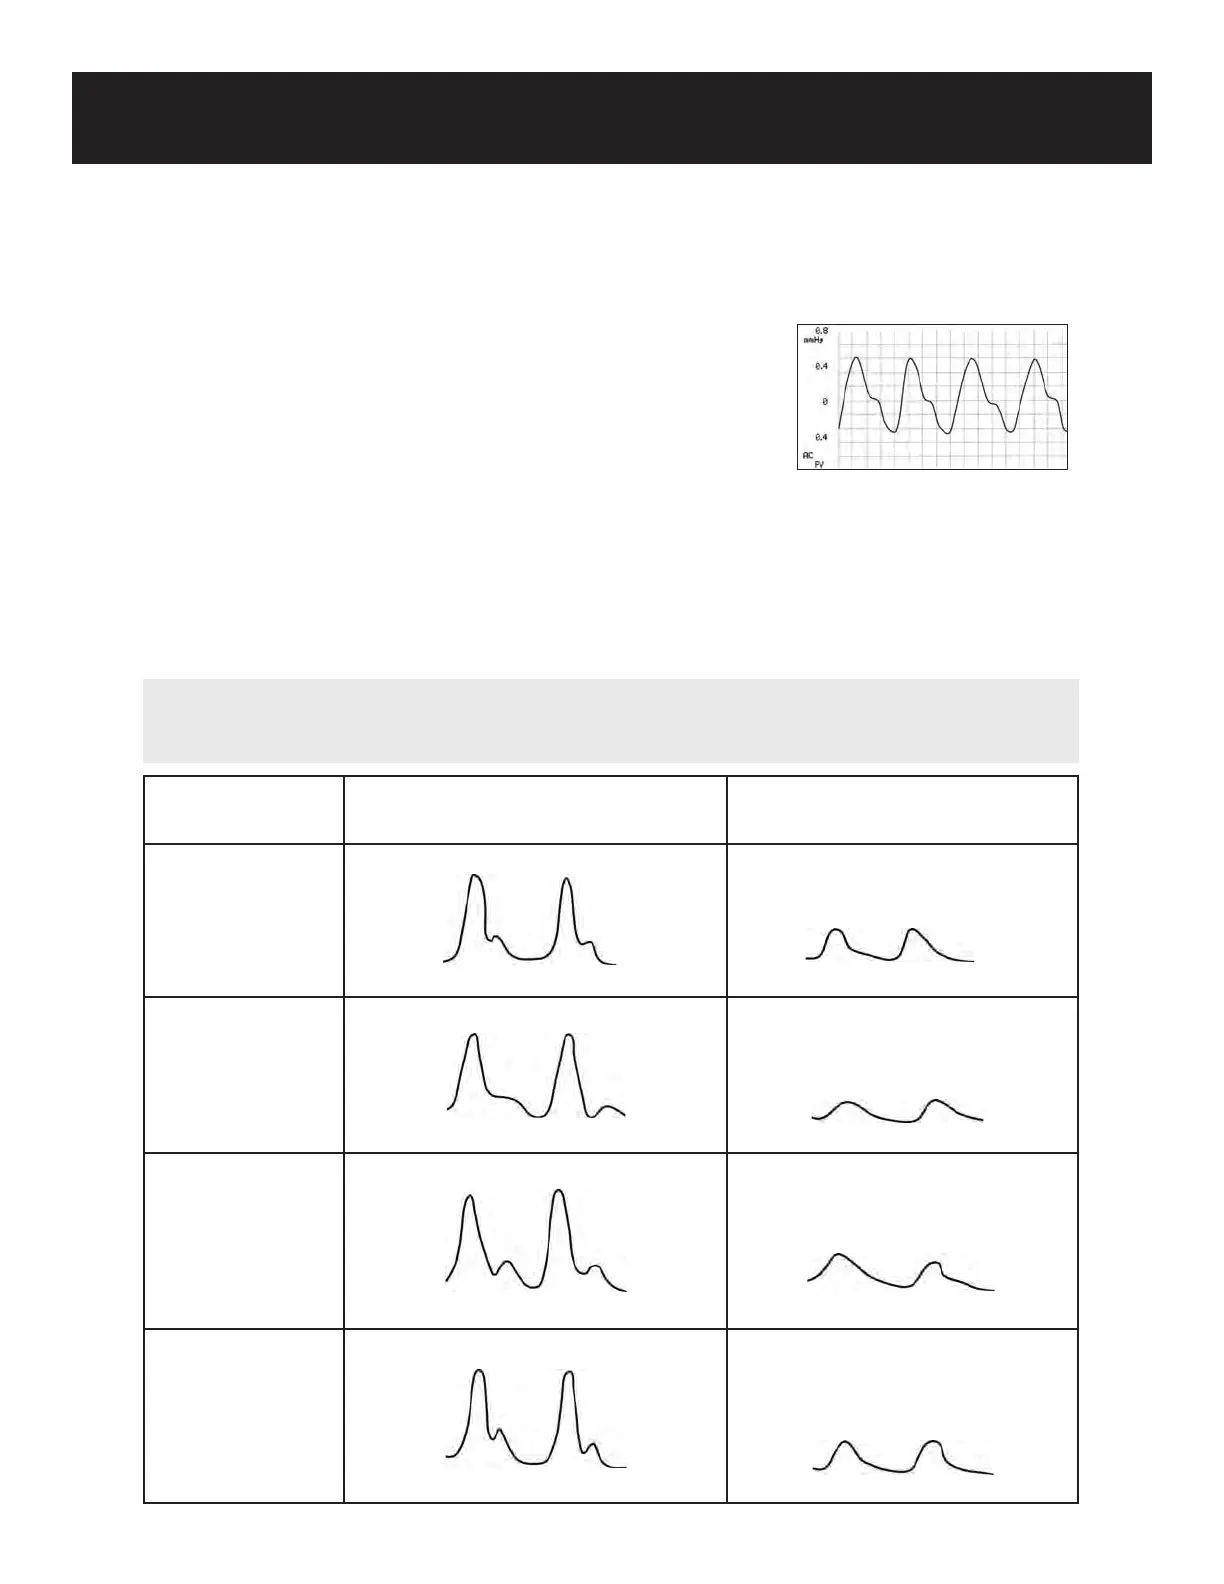
2-2 PULSE VOLUME ARTERIAL WAVEFORMS
A normal Pulse Volume arterial waveform will display a rapid rise
in the upstroke during systole and a sharp peak at maximum
amplitude, followed by a gradual downstroke following peak
amplitude, and usually the presence of a dicrotic notch.
The rst sign of possible abnormality is the absence of
the dicrotic notch. More signicant occlusions will show a
decreased slope of the ascending and descending segments,
and a rounding of the systolic peak occurs. More serious obstructions will show attened
waveforms.
It is important to note that arteries located lower on the leg will produce sharper waveform
peaks, while those located higher on the leg will produce more rounded waveforms.
Brachial
Thigh
Below Knee
Ankle
Typical Normal Waveform Typical Abnormal Waveform
NOTE
PV waveforms are quantied in changes of mmHg, this is not a systolic pressure or an exact
quantication.